Liberian vs Ethiopian Female Poverty Among 25-34 Year Olds
COMPARE
Liberian
Ethiopian
Female Poverty Among 25-34 Year Olds
Female Poverty Among 25-34 Year Olds Comparison
Liberians
Ethiopians
15.3%
FEMALE POVERTY AMONG 25-34 YEAR OLDS
0.2/ 100
METRIC RATING
261st/ 347
METRIC RANK
12.4%
FEMALE POVERTY AMONG 25-34 YEAR OLDS
98.0/ 100
METRIC RATING
82nd/ 347
METRIC RANK
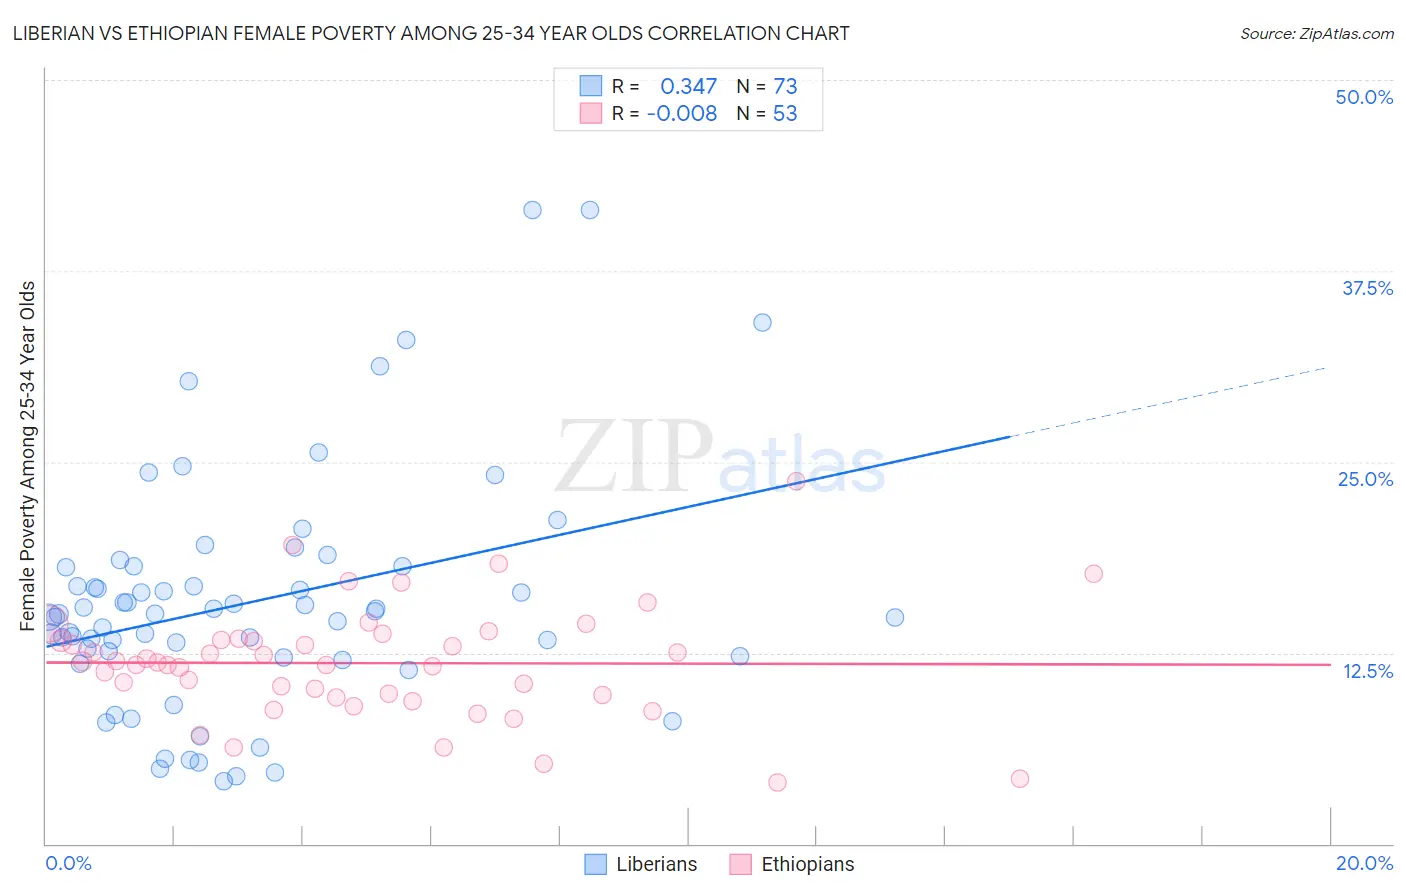
Liberian vs Ethiopian Female Poverty Among 25-34 Year Olds Correlation Chart
The statistical analysis conducted on geographies consisting of 117,573,543 people shows a mild positive correlation between the proportion of Liberians and poverty level among females between the ages 25 and 34 in the United States with a correlation coefficient (R) of 0.347 and weighted average of 15.3%. Similarly, the statistical analysis conducted on geographies consisting of 221,750,930 people shows no correlation between the proportion of Ethiopians and poverty level among females between the ages 25 and 34 in the United States with a correlation coefficient (R) of -0.008 and weighted average of 12.4%, a difference of 23.1%.
Female Poverty Among 25-34 Year Olds Correlation Summary
| Measurement | Liberian | Ethiopian |
| Minimum | 4.1% | 4.0% |
| Maximum | 41.5% | 23.7% |
| Range | 37.4% | 19.7% |
| Mean | 15.8% | 11.8% |
| Median | 15.0% | 11.9% |
| Interquartile 25% (IQ1) | 12.2% | 9.7% |
| Interquartile 75% (IQ3) | 18.1% | 13.4% |
| Interquartile Range (IQR) | 5.9% | 3.7% |
| Standard Deviation (Sample) | 7.7% | 3.7% |
| Standard Deviation (Population) | 7.6% | 3.7% |
Similar Demographics by Female Poverty Among 25-34 Year Olds
Demographics Similar to Liberians by Female Poverty Among 25-34 Year Olds
In terms of female poverty among 25-34 year olds, the demographic groups most similar to Liberians are Immigrants from Belize (15.3%, a difference of 0.040%), Marshallese (15.3%, a difference of 0.22%), Mexican American Indian (15.4%, a difference of 0.28%), Immigrants from Cuba (15.2%, a difference of 0.58%), and Nepalese (15.2%, a difference of 0.61%).
| Demographics | Rating | Rank | Female Poverty Among 25-34 Year Olds |
| Somalis | 0.4 /100 | #254 | Tragic 15.1% |
| Immigrants | Laos | 0.3 /100 | #255 | Tragic 15.2% |
| West Indians | 0.3 /100 | #256 | Tragic 15.2% |
| Immigrants | Burma/Myanmar | 0.3 /100 | #257 | Tragic 15.2% |
| Nepalese | 0.2 /100 | #258 | Tragic 15.2% |
| Immigrants | Cuba | 0.2 /100 | #259 | Tragic 15.2% |
| Marshallese | 0.2 /100 | #260 | Tragic 15.3% |
| Liberians | 0.2 /100 | #261 | Tragic 15.3% |
| Immigrants | Belize | 0.2 /100 | #262 | Tragic 15.3% |
| Mexican American Indians | 0.2 /100 | #263 | Tragic 15.4% |
| Pennsylvania Germans | 0.1 /100 | #264 | Tragic 15.4% |
| Immigrants | Liberia | 0.1 /100 | #265 | Tragic 15.4% |
| Immigrants | Somalia | 0.1 /100 | #266 | Tragic 15.4% |
| Central Americans | 0.1 /100 | #267 | Tragic 15.5% |
| Immigrants | Senegal | 0.1 /100 | #268 | Tragic 15.6% |
Demographics Similar to Ethiopians by Female Poverty Among 25-34 Year Olds
In terms of female poverty among 25-34 year olds, the demographic groups most similar to Ethiopians are Immigrants from Kazakhstan (12.4%, a difference of 0.080%), Immigrants from Malaysia (12.4%, a difference of 0.32%), Albanian (12.5%, a difference of 0.32%), Immigrants from Latvia (12.5%, a difference of 0.38%), and Immigrants from South Eastern Asia (12.5%, a difference of 0.49%).
| Demographics | Rating | Rank | Female Poverty Among 25-34 Year Olds |
| Estonians | 98.9 /100 | #75 | Exceptional 12.3% |
| Greeks | 98.9 /100 | #76 | Exceptional 12.3% |
| Immigrants | Italy | 98.8 /100 | #77 | Exceptional 12.3% |
| Immigrants | Ukraine | 98.6 /100 | #78 | Exceptional 12.3% |
| Immigrants | Jordan | 98.5 /100 | #79 | Exceptional 12.4% |
| Immigrants | Malaysia | 98.3 /100 | #80 | Exceptional 12.4% |
| Immigrants | Kazakhstan | 98.1 /100 | #81 | Exceptional 12.4% |
| Ethiopians | 98.0 /100 | #82 | Exceptional 12.4% |
| Albanians | 97.7 /100 | #83 | Exceptional 12.5% |
| Immigrants | Latvia | 97.7 /100 | #84 | Exceptional 12.5% |
| Immigrants | South Eastern Asia | 97.6 /100 | #85 | Exceptional 12.5% |
| Croatians | 97.5 /100 | #86 | Exceptional 12.5% |
| Argentineans | 97.5 /100 | #87 | Exceptional 12.5% |
| Immigrants | Austria | 97.4 /100 | #88 | Exceptional 12.5% |
| Italians | 97.2 /100 | #89 | Exceptional 12.5% |