Liberian vs Immigrants from Latvia Associate's Degree

COMPARE

Liberian
Race
Ancestry
AfghanAfricanAlaska NativeAlaskan AthabascanAlbanianAleutAlsatianAmericanApacheArabArapahoArgentineanArmenianAssyrian/Chaldean/SyriacAustralianAustrianBahamianBangladeshiBarbadianBasqueBelgianBelizeanBermudanBhutaneseBlackfeetBolivianBrazilianBritishBritish West IndianBulgarianBurmeseCajunCambodianCanadianCape VerdeanCarpatho RusynCelticCentral AmericanCentral American IndianCherokeeCheyenneChickasawChileanChineseChippewaChoctawColombianColvilleComancheCosta RicanCreeCreekCroatianCrowCubanCypriotCzechCzechoslovakianDanishDelawareDominicanDutchDutch West IndianEastern EuropeanEcuadorianEgyptianEnglishEstonianEthiopianEuropeanFijianFilipinoFinnishFrenchFrench American IndianFrench CanadianGermanGerman RussianGhanaianGreekGuamanian/ChamorroGuatemalanGuyaneseHaitianHmongHonduranHopiHoumaHungarianIcelanderIndian (Asian)IndonesianInupiatIranianIraqiIrishIroquoisIsraeliItalianJamaicanJapaneseJordanianKenyanKiowaKoreanLaotianLatvianLebaneseLiberianLithuanianLumbeeLuxembourgerMacedonianMalaysianMalteseMarshalleseMenomineeMexicanMexican American IndianMongolianMoroccanNative HawaiianNavajoNepaleseNew ZealanderNicaraguanNigerianNorthern EuropeanNorwegianOkinawanOsageOttawaPaiutePakistaniPalestinianPanamanianParaguayanPennsylvania GermanPeruvianPimaPolishPortuguesePotawatomiPuebloPuerto RicanPuget Sound SalishRomanianRussianSalvadoranSamoanScandinavianScotch-IrishScottishSeminoleSenegaleseSerbianShoshoneSierra LeoneanSiouxSlavicSlovakSloveneSomaliSouth AfricanSouth AmericanSouth American IndianSoviet UnionSpaniardSpanishSpanish AmericanSpanish American IndianSri LankanSubsaharan AfricanSudaneseSwedishSwissSyrianTaiwaneseThaiTlingit-HaidaTohono O'OdhamTonganTrinidadian and TobagonianTsimshianTurkishU.S. Virgin IslanderUgandanUkrainianUruguayanUteVenezuelanVietnameseWelshWest IndianYakamaYaquiYugoslavianYumanYup'ikZimbabwean
Immigration
NonimmigrantsImmigrantsAfghanistanAfricaAlbaniaArgentinaArmeniaAsiaAustraliaAustriaBahamasBangladeshBarbadosBelarusBelgiumBelizeBoliviaBosnia and HerzegovinaBrazilBulgariaBurma/MyanmarCabo VerdeCambodiaCameroonCanadaCaribbeanCentral AmericaChileChinaColombiaCongoCosta RicaCroatiaCubaCzechoslovakiaDenmarkDominicaDominican RepublicEastern AfricaEastern AsiaEastern EuropeEcuadorEgyptEl SalvadorEnglandEritreaEthiopiaEuropeFijiFranceGermanyGhanaGreeceGrenadaGuatemalaGuyanaHaitiHondurasHong KongHungaryIndiaIndonesiaIranIraqIrelandIsraelItalyJamaicaJapanJordanKazakhstanKenyaKoreaKuwaitLaosLatin AmericaLebanonLiberiaLithuaniaMalaysiaMexicoMicronesiaMiddle AfricaMoldovaMoroccoNepalNetherlandsNicaraguaNigeriaNorth AmericaNorth MacedoniaNorthern AfricaNorthern EuropeNorwayOceaniaPakistanPanamaPeruPhilippinesPolandPortugalRomaniaRussiaSaudi ArabiaScotlandSenegalSerbiaSierra LeoneSingaporeSomaliaSouth AfricaSouth AmericaSouth Central AsiaSouth Eastern AsiaSouthern EuropeSpainSri LankaSt. Vincent and the GrenadinesSudanSwedenSwitzerlandSyriaTaiwanThailandTrinidad and TobagoTurkeyUgandaUkraineUruguayUzbekistanVenezuelaVietnamWest IndiesWestern AfricaWestern AsiaWestern EuropeYemenZaireZimbabweAzores
Immigrants from Latvia
Race
Ancestry
AfghanAfricanAlaska NativeAlaskan AthabascanAlbanianAleutAlsatianAmericanApacheArabArapahoArgentineanArmenianAssyrian/Chaldean/SyriacAustralianAustrianBahamianBangladeshiBarbadianBasqueBelgianBelizeanBermudanBhutaneseBlackfeetBolivianBrazilianBritishBritish West IndianBulgarianBurmeseCajunCambodianCanadianCape VerdeanCarpatho RusynCelticCentral AmericanCentral American IndianCherokeeCheyenneChickasawChileanChineseChippewaChoctawColombianColvilleComancheCosta RicanCreeCreekCroatianCrowCubanCypriotCzechCzechoslovakianDanishDelawareDominicanDutchDutch West IndianEastern EuropeanEcuadorianEgyptianEnglishEstonianEthiopianEuropeanFijianFilipinoFinnishFrenchFrench American IndianFrench CanadianGermanGerman RussianGhanaianGreekGuamanian/ChamorroGuatemalanGuyaneseHaitianHmongHonduranHopiHoumaHungarianIcelanderIndian (Asian)IndonesianInupiatIranianIraqiIrishIroquoisIsraeliItalianJamaicanJapaneseJordanianKenyanKiowaKoreanLaotianLatvianLebaneseLithuanianLumbeeLuxembourgerMacedonianMalaysianMalteseMarshalleseMenomineeMexicanMexican American IndianMongolianMoroccanNative HawaiianNavajoNepaleseNew ZealanderNicaraguanNigerianNorthern EuropeanNorwegianOkinawanOsageOttawaPaiutePakistaniPalestinianPanamanianParaguayanPennsylvania GermanPeruvianPimaPolishPortuguesePotawatomiPuebloPuerto RicanPuget Sound SalishRomanianRussianSalvadoranSamoanScandinavianScotch-IrishScottishSeminoleSenegaleseSerbianShoshoneSierra LeoneanSiouxSlavicSlovakSloveneSomaliSouth AfricanSouth AmericanSouth American IndianSoviet UnionSpaniardSpanishSpanish AmericanSpanish American IndianSri LankanSubsaharan AfricanSudaneseSwedishSwissSyrianTaiwaneseThaiTlingit-HaidaTohono O'OdhamTonganTrinidadian and TobagonianTsimshianTurkishU.S. Virgin IslanderUgandanUkrainianUruguayanUteVenezuelanVietnameseWelshWest IndianYakamaYaquiYugoslavianYumanYup'ikZimbabwean
Immigration
NonimmigrantsImmigrantsAfghanistanAfricaAlbaniaArgentinaArmeniaAsiaAustraliaAustriaBahamasBangladeshBarbadosBelarusBelgiumBelizeBoliviaBosnia and HerzegovinaBrazilBulgariaBurma/MyanmarCabo VerdeCambodiaCameroonCanadaCaribbeanCentral AmericaChileChinaColombiaCongoCosta RicaCroatiaCubaCzechoslovakiaDenmarkDominicaDominican RepublicEastern AfricaEastern AsiaEastern EuropeEcuadorEgyptEl SalvadorEnglandEritreaEthiopiaEuropeFijiFranceGermanyGhanaGreeceGrenadaGuatemalaGuyanaHaitiHondurasHong KongHungaryIndiaIndonesiaIranIraqIrelandIsraelItalyJamaicaJapanJordanKazakhstanKenyaKoreaKuwaitLaosLatin AmericaLatviaLebanonLiberiaLithuaniaMalaysiaMexicoMicronesiaMiddle AfricaMoldovaMoroccoNepalNetherlandsNicaraguaNigeriaNorth AmericaNorth MacedoniaNorthern AfricaNorthern EuropeNorwayOceaniaPakistanPanamaPeruPhilippinesPolandPortugalRomaniaRussiaSaudi ArabiaScotlandSenegalSerbiaSierra LeoneSingaporeSomaliaSouth AfricaSouth AmericaSouth Central AsiaSouth Eastern AsiaSouthern EuropeSpainSri LankaSt. Vincent and the GrenadinesSudanSwedenSwitzerlandSyriaTaiwanThailandTrinidad and TobagoTurkeyUgandaUkraineUruguayUzbekistanVenezuelaVietnamWest IndiesWestern AfricaWestern AsiaWestern EuropeYemenZaireZimbabweAzores
Associate's Degree
Income
Poverty
Unemployment
Labor Participation
Family Structure
Vehicle Availability
Education Level
Disability

Associate's Degree Comparison

Liberians

Immigrants from Latvia

Tragic
Exceptional
43.3%
ASSOCIATE'S DEGREE
2.9/ 100
METRIC RATING
231st/ 347
METRIC RANK
52.8%
ASSOCIATE'S DEGREE
99.9/ 100
METRIC RATING
40th/ 347
METRIC RANK

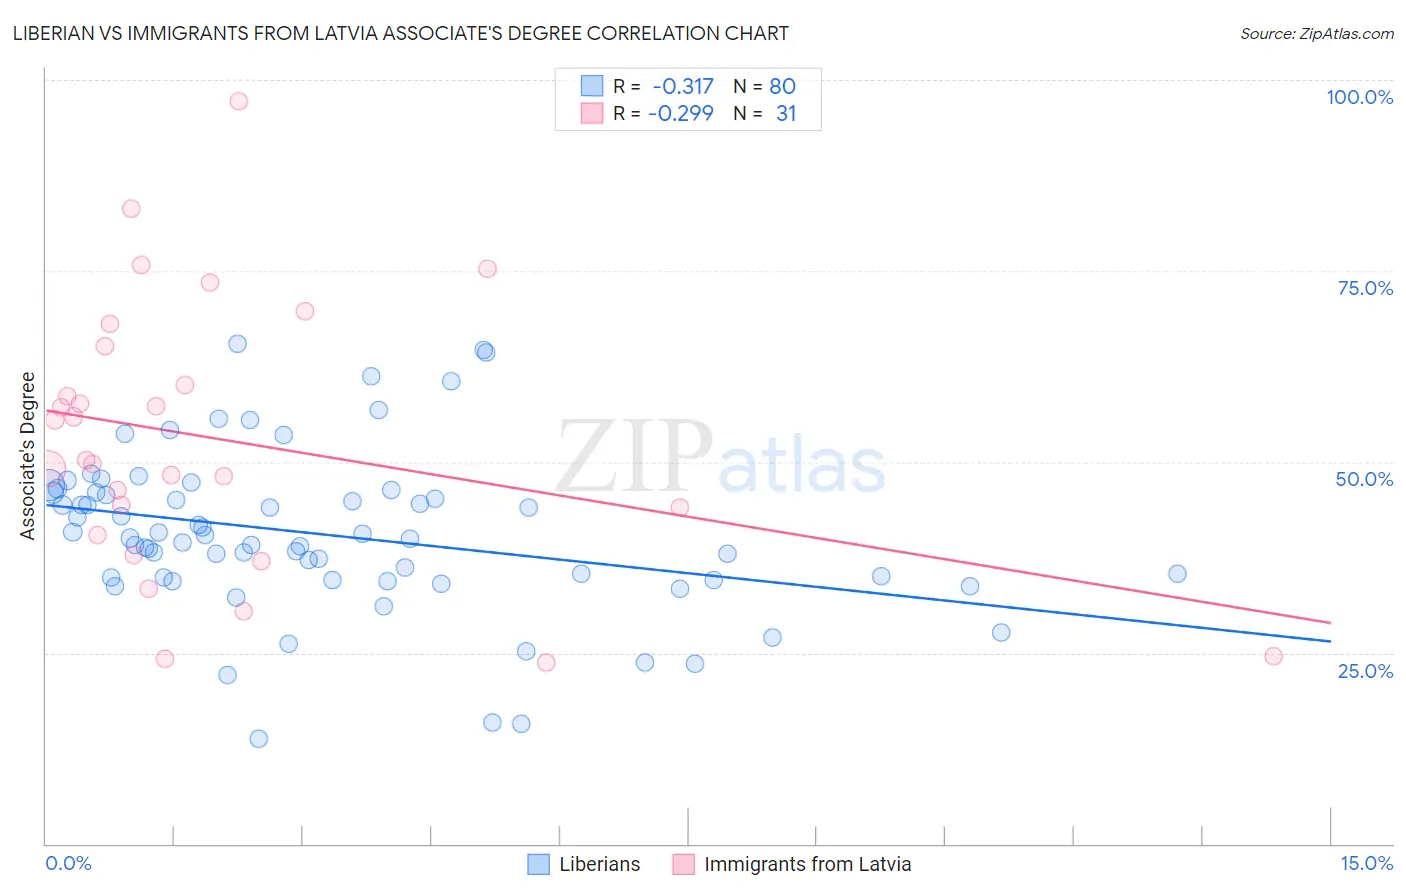
Liberian vs Immigrants from Latvia Associate's Degree Correlation Chart

The statistical analysis conducted on geographies consisting of 118,102,624 people shows a mild negative correlation between the proportion of Liberians and percentage of population with at least associate's degree education in the United States with a correlation coefficient (R) of -0.317 and weighted average of 43.3%. Similarly, the statistical analysis conducted on geographies consisting of 113,735,345 people shows a weak negative correlation between the proportion of Immigrants from Latvia and percentage of population with at least associate's degree education in the United States with a correlation coefficient (R) of -0.299 and weighted average of 52.8%, a difference of 21.9%.
Liberian vs Immigrants from Latvia Associate's Degree

Associate's Degree Correlation Summary

MeasurementLiberianImmigrants from Latvia
Minimum13.8%23.7%
Maximum65.5%97.2%
Range51.7%73.5%
Mean40.5%53.0%
Median39.9%50.3%
Interquartile 25% (IQ1)34.7%40.4%
Interquartile 75% (IQ3)45.9%65.2%
Interquartile Range (IQR)11.3%24.8%
Standard Deviation (Sample)10.6%17.7%
Standard Deviation (Population)10.5%17.4%

Similar Demographics by Associate's Degree

Demographics Similar to Liberians by Associate's Degree

In terms of associate's degree, the demographic groups most similar to Liberians are Immigrants from Barbados (43.3%, a difference of 0.010%), Immigrants from Trinidad and Tobago (43.3%, a difference of 0.080%), Hmong (43.4%, a difference of 0.23%), Native Hawaiian (43.1%, a difference of 0.43%), and Tongan (43.0%, a difference of 0.59%).
DemographicsRating | RankAssociate's Degree
West Indians
5.2
/100
|
#224
Tragic
43.8%
Guamanians/Chamorros
4.8
/100
|
#225
Tragic
43.8%
Immigrants | Burma/Myanmar
4.3
/100
|
#226
Tragic
43.7%
Trinidadians and Tobagonians
4.0
/100
|
#227
Tragic
43.6%
Hmong
3.2
/100
|
#228
Tragic
43.4%
Immigrants | Trinidad and Tobago
3.0
/100
|
#229
Tragic
43.3%
Immigrants | Barbados
2.9
/100
|
#230
Tragic
43.3%
Liberians
2.9
/100
|
#231
Tragic
43.3%
Native Hawaiians
2.3
/100
|
#232
Tragic
43.1%
Tongans
2.2
/100
|
#233
Tragic
43.0%
Tlingit-Haida
2.1
/100
|
#234
Tragic
43.0%
Ecuadorians
2.0
/100
|
#235
Tragic
43.0%
Immigrants | St. Vincent and the Grenadines
1.9
/100
|
#236
Tragic
42.9%
Immigrants | Nonimmigrants
1.9
/100
|
#237
Tragic
42.9%
Iroquois
1.7
/100
|
#238
Tragic
42.8%

Demographics Similar to Immigrants from Latvia by Associate's Degree

In terms of associate's degree, the demographic groups most similar to Immigrants from Latvia are Immigrants from Belarus (52.8%, a difference of 0.070%), Mongolian (53.0%, a difference of 0.36%), Immigrants from Saudi Arabia (52.6%, a difference of 0.43%), Immigrants from Malaysia (52.5%, a difference of 0.46%), and Immigrants from South Africa (52.5%, a difference of 0.47%).
DemographicsRating | RankAssociate's Degree
Israelis
100.0
/100
|
#33
Exceptional
53.4%
Bulgarians
100.0
/100
|
#34
Exceptional
53.3%
Russians
100.0
/100
|
#35
Exceptional
53.2%
Immigrants | Russia
100.0
/100
|
#36
Exceptional
53.1%
Immigrants | Denmark
100.0
/100
|
#37
Exceptional
53.1%
Mongolians
100.0
/100
|
#38
Exceptional
53.0%
Immigrants | Belarus
99.9
/100
|
#39
Exceptional
52.8%
Immigrants | Latvia
99.9
/100
|
#40
Exceptional
52.8%
Immigrants | Saudi Arabia
99.9
/100
|
#41
Exceptional
52.6%
Immigrants | Malaysia
99.9
/100
|
#42
Exceptional
52.5%
Immigrants | South Africa
99.9
/100
|
#43
Exceptional
52.5%
Estonians
99.9
/100
|
#44
Exceptional
52.5%
Immigrants | Lithuania
99.9
/100
|
#45
Exceptional
52.4%
Immigrants | Bulgaria
99.9
/100
|
#46
Exceptional
52.4%
Immigrants | Kuwait
99.9
/100
|
#47
Exceptional
52.4%