Liberian vs British Householder Income Under 25 years
COMPARE
Liberian
British
Householder Income Under 25 years
Householder Income Under 25 years Comparison
Liberians
British
$48,917
HOUSEHOLDER INCOME UNDER 25 YEARS
0.0/ 100
METRIC RATING
288th/ 347
METRIC RANK
$51,477
HOUSEHOLDER INCOME UNDER 25 YEARS
14.9/ 100
METRIC RATING
201st/ 347
METRIC RANK
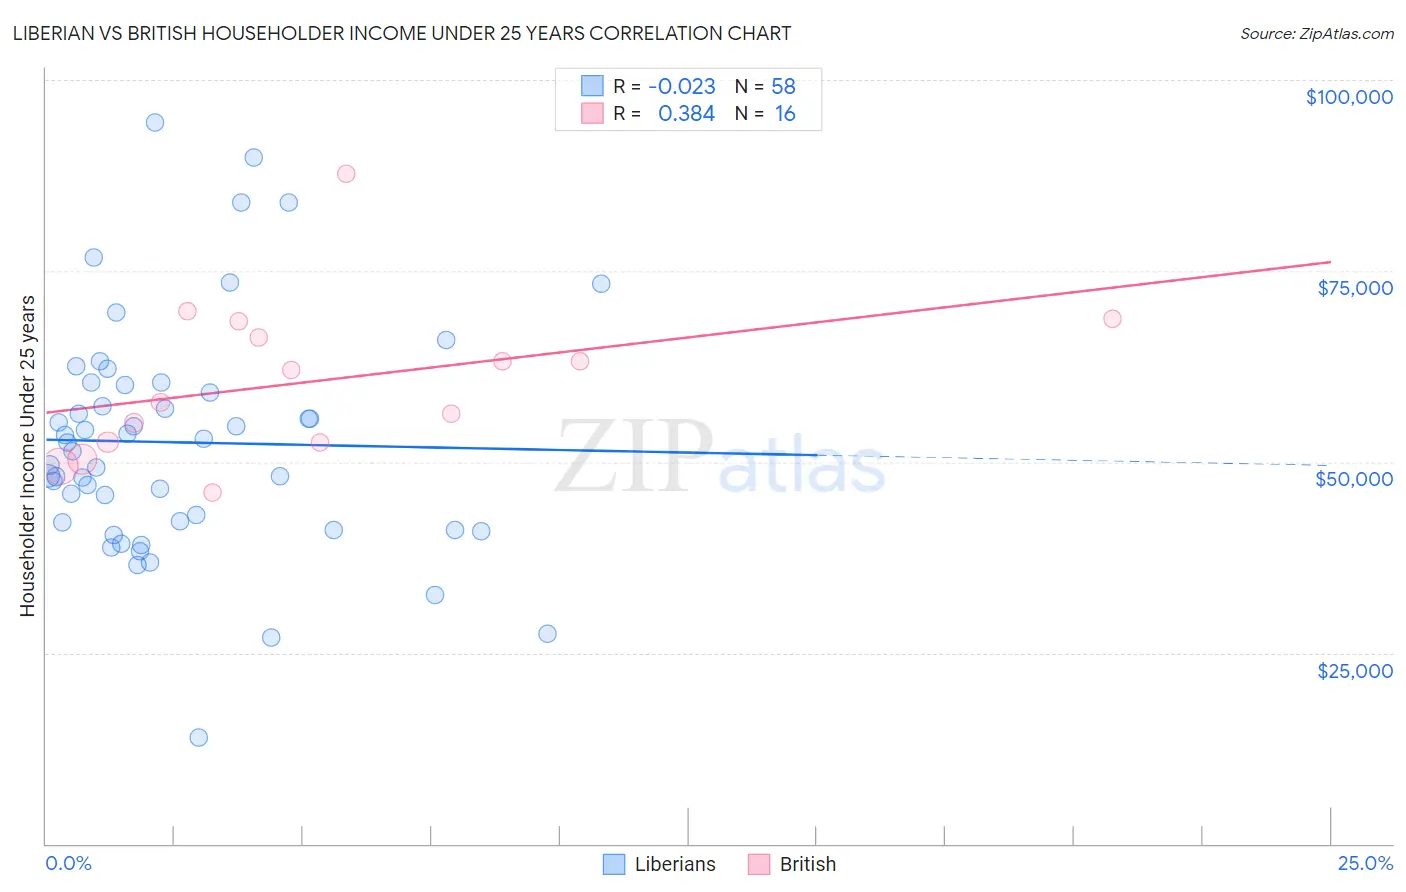
Liberian vs British Householder Income Under 25 years Correlation Chart
The statistical analysis conducted on geographies consisting of 110,653,679 people shows no correlation between the proportion of Liberians and household income with householder under the age of 25 in the United States with a correlation coefficient (R) of -0.023 and weighted average of $48,917. Similarly, the statistical analysis conducted on geographies consisting of 421,331,557 people shows a mild positive correlation between the proportion of British and household income with householder under the age of 25 in the United States with a correlation coefficient (R) of 0.384 and weighted average of $51,477, a difference of 5.2%.
Householder Income Under 25 years Correlation Summary
| Measurement | Liberian | British |
| Minimum | $13,942 | $46,064 |
| Maximum | $94,479 | $87,721 |
| Range | $80,537 | $41,657 |
| Mean | $52,552 | $60,580 |
| Median | $51,943 | $59,896 |
| Interquartile 25% (IQ1) | $42,067 | $52,513 |
| Interquartile 75% (IQ3) | $60,104 | $67,314 |
| Interquartile Range (IQR) | $18,037 | $14,801 |
| Standard Deviation (Sample) | $15,238 | $10,393 |
| Standard Deviation (Population) | $15,106 | $10,063 |
Similar Demographics by Householder Income Under 25 years
Demographics Similar to Liberians by Householder Income Under 25 years
In terms of householder income under 25 years, the demographic groups most similar to Liberians are Honduran ($48,885, a difference of 0.060%), Senegalese ($48,953, a difference of 0.070%), French American Indian ($48,977, a difference of 0.12%), American ($48,860, a difference of 0.12%), and Scotch-Irish ($49,039, a difference of 0.25%).
| Demographics | Rating | Rank | Householder Income Under 25 years |
| Immigrants | Nonimmigrants | 0.1 /100 | #281 | Tragic $49,348 |
| Alsatians | 0.1 /100 | #282 | Tragic $49,267 |
| Immigrants | Nigeria | 0.1 /100 | #283 | Tragic $49,174 |
| Carpatho Rusyns | 0.1 /100 | #284 | Tragic $49,113 |
| Scotch-Irish | 0.0 /100 | #285 | Tragic $49,039 |
| French American Indians | 0.0 /100 | #286 | Tragic $48,977 |
| Senegalese | 0.0 /100 | #287 | Tragic $48,953 |
| Liberians | 0.0 /100 | #288 | Tragic $48,917 |
| Hondurans | 0.0 /100 | #289 | Tragic $48,885 |
| Americans | 0.0 /100 | #290 | Tragic $48,860 |
| Immigrants | Burma/Myanmar | 0.0 /100 | #291 | Tragic $48,749 |
| Shoshone | 0.0 /100 | #292 | Tragic $48,720 |
| Sub-Saharan Africans | 0.0 /100 | #293 | Tragic $48,691 |
| Somalis | 0.0 /100 | #294 | Tragic $48,657 |
| Central American Indians | 0.0 /100 | #295 | Tragic $48,643 |
Demographics Similar to British by Householder Income Under 25 years
In terms of householder income under 25 years, the demographic groups most similar to British are Immigrants from West Indies ($51,479, a difference of 0.0%), Immigrants from Syria ($51,494, a difference of 0.030%), Swiss ($51,493, a difference of 0.030%), Pima ($51,503, a difference of 0.050%), and Immigrants from Guatemala ($51,447, a difference of 0.060%).
| Demographics | Rating | Rank | Householder Income Under 25 years |
| Guatemalans | 16.4 /100 | #194 | Poor $51,525 |
| Estonians | 16.4 /100 | #195 | Poor $51,523 |
| Palestinians | 16.1 /100 | #196 | Poor $51,515 |
| Pima | 15.7 /100 | #197 | Poor $51,503 |
| Immigrants | Syria | 15.4 /100 | #198 | Poor $51,494 |
| Swiss | 15.4 /100 | #199 | Poor $51,493 |
| Immigrants | West Indies | 14.9 /100 | #200 | Poor $51,479 |
| British | 14.9 /100 | #201 | Poor $51,477 |
| Immigrants | Guatemala | 14.0 /100 | #202 | Poor $51,447 |
| Immigrants | Cameroon | 13.6 /100 | #203 | Poor $51,433 |
| Czechs | 13.2 /100 | #204 | Poor $51,421 |
| Cape Verdeans | 12.3 /100 | #205 | Poor $51,387 |
| Immigrants | Latin America | 12.3 /100 | #206 | Poor $51,387 |
| South Africans | 12.2 /100 | #207 | Poor $51,383 |
| Immigrants | Jordan | 11.9 /100 | #208 | Poor $51,370 |