Liberian vs Immigrants from Netherlands College, 1 year or more
COMPARE
Liberian
Immigrants from Netherlands
College, 1 year or more
College, 1 year or more Comparison
Liberians
Immigrants from Netherlands
56.7%
COLLEGE, 1 YEAR OR MORE
3.1/ 100
METRIC RATING
230th/ 347
METRIC RANK
64.2%
COLLEGE, 1 YEAR OR MORE
99.8/ 100
METRIC RATING
52nd/ 347
METRIC RANK
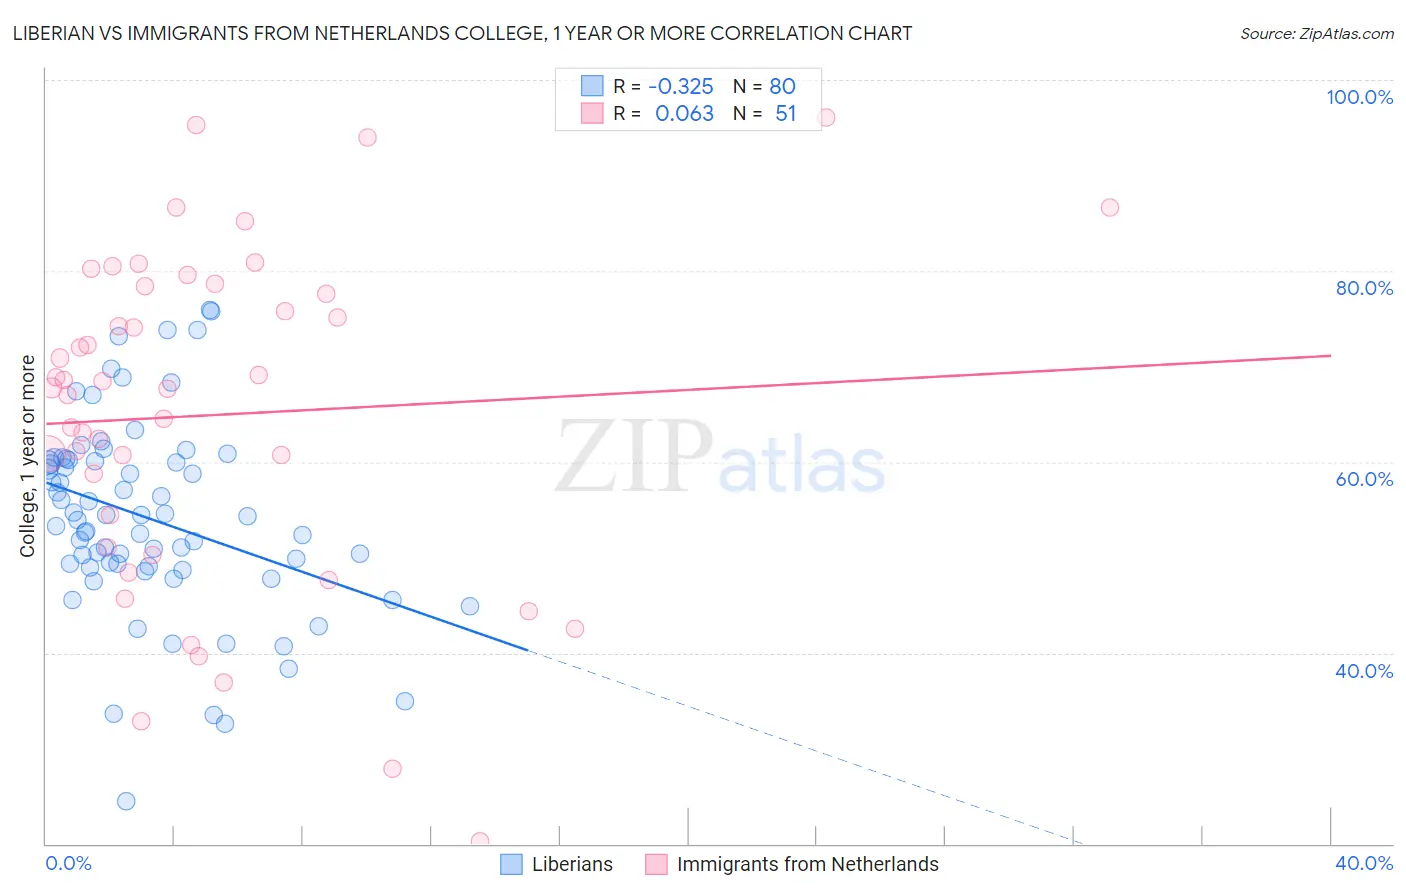
Liberian vs Immigrants from Netherlands College, 1 year or more Correlation Chart
The statistical analysis conducted on geographies consisting of 118,103,458 people shows a mild negative correlation between the proportion of Liberians and percentage of population with at least college, 1 year or more education in the United States with a correlation coefficient (R) of -0.325 and weighted average of 56.7%. Similarly, the statistical analysis conducted on geographies consisting of 237,877,405 people shows a slight positive correlation between the proportion of Immigrants from Netherlands and percentage of population with at least college, 1 year or more education in the United States with a correlation coefficient (R) of 0.063 and weighted average of 64.2%, a difference of 13.3%.
College, 1 year or more Correlation Summary
| Measurement | Liberian | Immigrants from Netherlands |
| Minimum | 24.5% | 20.3% |
| Maximum | 75.9% | 96.1% |
| Range | 51.4% | 75.8% |
| Mean | 54.1% | 64.9% |
| Median | 54.1% | 67.8% |
| Interquartile 25% (IQ1) | 49.0% | 51.0% |
| Interquartile 75% (IQ3) | 60.1% | 78.5% |
| Interquartile Range (IQR) | 11.1% | 27.5% |
| Standard Deviation (Sample) | 10.2% | 17.5% |
| Standard Deviation (Population) | 10.1% | 17.3% |
Similar Demographics by College, 1 year or more
Demographics Similar to Liberians by College, 1 year or more
In terms of college, 1 year or more, the demographic groups most similar to Liberians are Immigrants from Burma/Myanmar (56.6%, a difference of 0.19%), Cree (56.8%, a difference of 0.22%), Immigrants from Bangladesh (56.6%, a difference of 0.25%), Nonimmigrants (56.5%, a difference of 0.34%), and Immigrants from Fiji (56.9%, a difference of 0.35%).
| Demographics | Rating | Rank | College, 1 year or more |
| Portuguese | 5.4 /100 | #223 | Tragic 57.2% |
| Hmong | 5.4 /100 | #224 | Tragic 57.2% |
| Vietnamese | 4.7 /100 | #225 | Tragic 57.0% |
| Immigrants | Western Africa | 4.6 /100 | #226 | Tragic 57.0% |
| Immigrants | Immigrants | 4.4 /100 | #227 | Tragic 57.0% |
| Immigrants | Fiji | 4.0 /100 | #228 | Tragic 56.9% |
| Cree | 3.6 /100 | #229 | Tragic 56.8% |
| Liberians | 3.1 /100 | #230 | Tragic 56.7% |
| Immigrants | Burma/Myanmar | 2.7 /100 | #231 | Tragic 56.6% |
| Immigrants | Bangladesh | 2.6 /100 | #232 | Tragic 56.6% |
| Immigrants | Nonimmigrants | 2.5 /100 | #233 | Tragic 56.5% |
| Spanish Americans | 1.8 /100 | #234 | Tragic 56.3% |
| West Indians | 1.8 /100 | #235 | Tragic 56.3% |
| Iroquois | 1.7 /100 | #236 | Tragic 56.2% |
| Samoans | 1.6 /100 | #237 | Tragic 56.2% |
Demographics Similar to Immigrants from Netherlands by College, 1 year or more
In terms of college, 1 year or more, the demographic groups most similar to Immigrants from Netherlands are Asian (64.2%, a difference of 0.020%), Zimbabwean (64.2%, a difference of 0.050%), Immigrants from Malaysia (64.3%, a difference of 0.16%), Immigrants from Belarus (64.1%, a difference of 0.17%), and Immigrants from Czechoslovakia (64.1%, a difference of 0.20%).
| Demographics | Rating | Rank | College, 1 year or more |
| Immigrants | Lithuania | 99.9 /100 | #45 | Exceptional 64.6% |
| Bhutanese | 99.9 /100 | #46 | Exceptional 64.6% |
| Australians | 99.9 /100 | #47 | Exceptional 64.6% |
| Immigrants | Bulgaria | 99.9 /100 | #48 | Exceptional 64.6% |
| New Zealanders | 99.9 /100 | #49 | Exceptional 64.6% |
| Immigrants | Austria | 99.8 /100 | #50 | Exceptional 64.4% |
| Immigrants | Malaysia | 99.8 /100 | #51 | Exceptional 64.3% |
| Immigrants | Netherlands | 99.8 /100 | #52 | Exceptional 64.2% |
| Asians | 99.8 /100 | #53 | Exceptional 64.2% |
| Zimbabweans | 99.8 /100 | #54 | Exceptional 64.2% |
| Immigrants | Belarus | 99.7 /100 | #55 | Exceptional 64.1% |
| Immigrants | Czechoslovakia | 99.7 /100 | #56 | Exceptional 64.1% |
| South Africans | 99.7 /100 | #57 | Exceptional 64.1% |
| Immigrants | Asia | 99.7 /100 | #58 | Exceptional 64.0% |
| Immigrants | Serbia | 99.6 /100 | #59 | Exceptional 63.8% |