Immigrants from Vietnam vs Cree GED/Equivalency
COMPARE
Immigrants from Vietnam
Cree
GED/Equivalency
GED/Equivalency Comparison
Immigrants from Vietnam
Cree
83.2%
GED/EQUIVALENCY
0.3/ 100
METRIC RATING
259th/ 347
METRIC RANK
85.0%
GED/EQUIVALENCY
15.9/ 100
METRIC RATING
202nd/ 347
METRIC RANK
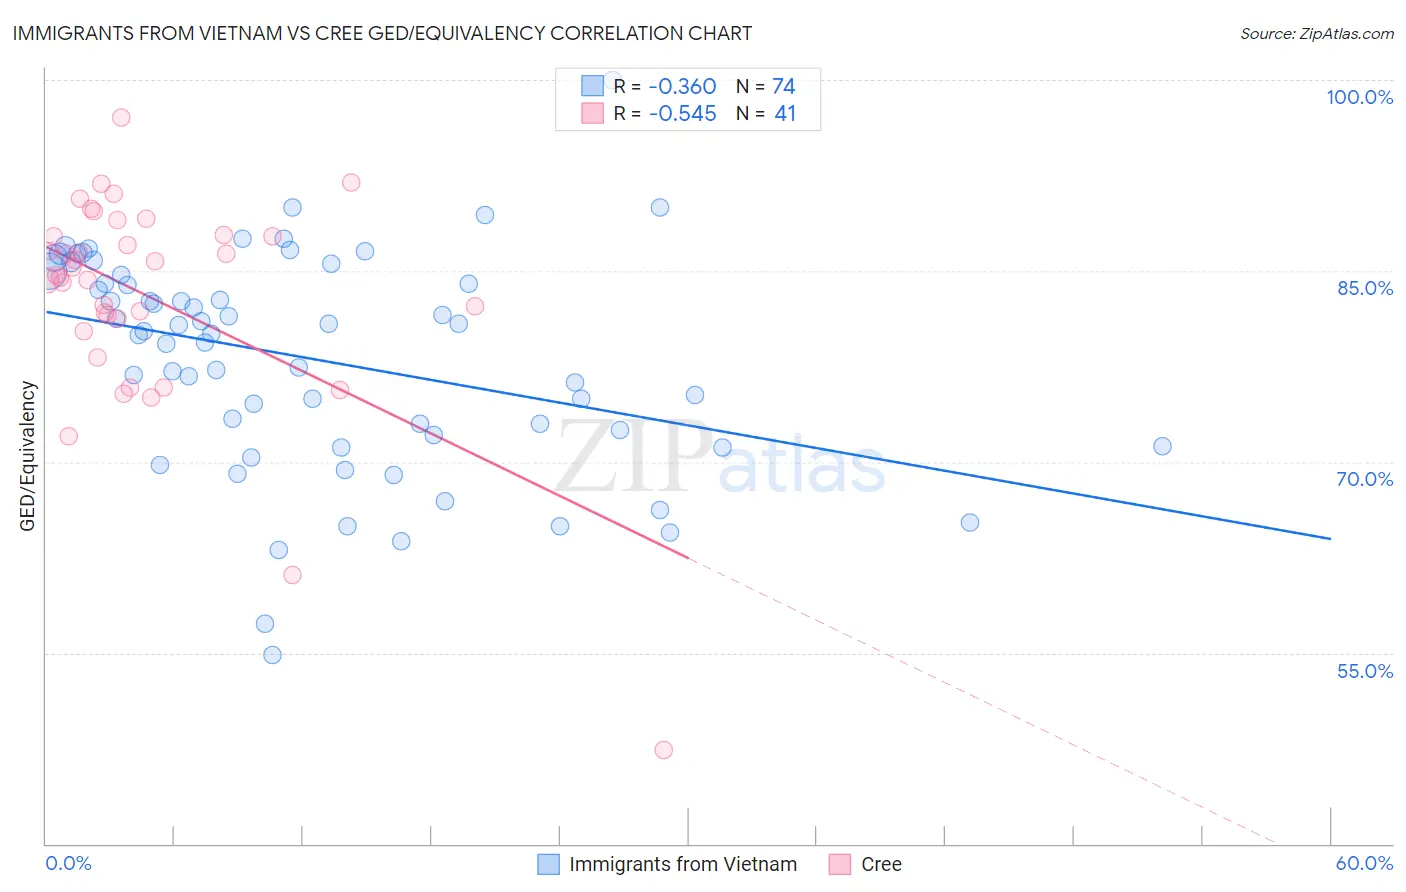
Immigrants from Vietnam vs Cree GED/Equivalency Correlation Chart
The statistical analysis conducted on geographies consisting of 404,843,872 people shows a mild negative correlation between the proportion of Immigrants from Vietnam and percentage of population with at least ged/equivalency education in the United States with a correlation coefficient (R) of -0.360 and weighted average of 83.2%. Similarly, the statistical analysis conducted on geographies consisting of 76,211,744 people shows a substantial negative correlation between the proportion of Cree and percentage of population with at least ged/equivalency education in the United States with a correlation coefficient (R) of -0.545 and weighted average of 85.0%, a difference of 2.2%.
GED/Equivalency Correlation Summary
| Measurement | Immigrants from Vietnam | Cree |
| Minimum | 54.8% | 47.4% |
| Maximum | 100.0% | 97.0% |
| Range | 45.2% | 49.7% |
| Mean | 78.1% | 83.0% |
| Median | 80.2% | 84.7% |
| Interquartile 25% (IQ1) | 72.1% | 80.8% |
| Interquartile 75% (IQ3) | 84.7% | 87.8% |
| Interquartile Range (IQR) | 12.6% | 7.0% |
| Standard Deviation (Sample) | 8.5% | 8.7% |
| Standard Deviation (Population) | 8.5% | 8.5% |
Similar Demographics by GED/Equivalency
Demographics Similar to Immigrants from Vietnam by GED/Equivalency
In terms of ged/equivalency, the demographic groups most similar to Immigrants from Vietnam are Choctaw (83.1%, a difference of 0.030%), Inupiat (83.1%, a difference of 0.090%), Immigrants from Armenia (83.1%, a difference of 0.090%), Immigrants from Congo (83.1%, a difference of 0.10%), and Bangladeshi (83.1%, a difference of 0.11%).
| Demographics | Rating | Rank | GED/Equivalency |
| Bahamians | 0.8 /100 | #252 | Tragic 83.6% |
| Comanche | 0.7 /100 | #253 | Tragic 83.6% |
| Creek | 0.7 /100 | #254 | Tragic 83.6% |
| Colville | 0.5 /100 | #255 | Tragic 83.4% |
| Africans | 0.5 /100 | #256 | Tragic 83.4% |
| Jamaicans | 0.4 /100 | #257 | Tragic 83.3% |
| Malaysians | 0.4 /100 | #258 | Tragic 83.3% |
| Immigrants | Vietnam | 0.3 /100 | #259 | Tragic 83.2% |
| Choctaw | 0.3 /100 | #260 | Tragic 83.1% |
| Inupiat | 0.2 /100 | #261 | Tragic 83.1% |
| Immigrants | Armenia | 0.2 /100 | #262 | Tragic 83.1% |
| Immigrants | Congo | 0.2 /100 | #263 | Tragic 83.1% |
| Bangladeshis | 0.2 /100 | #264 | Tragic 83.1% |
| West Indians | 0.2 /100 | #265 | Tragic 83.1% |
| Kiowa | 0.2 /100 | #266 | Tragic 83.1% |
Demographics Similar to Cree by GED/Equivalency
In terms of ged/equivalency, the demographic groups most similar to Cree are Portuguese (85.0%, a difference of 0.0%), Uruguayan (85.0%, a difference of 0.010%), Somali (85.0%, a difference of 0.020%), Panamanian (85.0%, a difference of 0.020%), and Hawaiian (85.0%, a difference of 0.030%).
| Demographics | Rating | Rank | GED/Equivalency |
| Chippewa | 20.8 /100 | #195 | Fair 85.2% |
| Tongans | 20.7 /100 | #196 | Fair 85.2% |
| Costa Ricans | 20.4 /100 | #197 | Fair 85.2% |
| Immigrants | Africa | 17.5 /100 | #198 | Poor 85.1% |
| Somalis | 16.4 /100 | #199 | Poor 85.0% |
| Uruguayans | 16.0 /100 | #200 | Poor 85.0% |
| Portuguese | 15.9 /100 | #201 | Poor 85.0% |
| Cree | 15.9 /100 | #202 | Poor 85.0% |
| Panamanians | 15.3 /100 | #203 | Poor 85.0% |
| Hawaiians | 15.2 /100 | #204 | Poor 85.0% |
| Liberians | 14.6 /100 | #205 | Poor 85.0% |
| Samoans | 13.7 /100 | #206 | Poor 84.9% |
| Hmong | 13.1 /100 | #207 | Poor 84.9% |
| Marshallese | 12.5 /100 | #208 | Poor 84.9% |
| Colombians | 12.3 /100 | #209 | Poor 84.9% |