Immigrants from Venezuela vs Cree GED/Equivalency
COMPARE
Immigrants from Venezuela
Cree
GED/Equivalency
GED/Equivalency Comparison
Immigrants from Venezuela
Cree
85.8%
GED/EQUIVALENCY
50.7/ 100
METRIC RATING
173rd/ 347
METRIC RANK
85.0%
GED/EQUIVALENCY
15.9/ 100
METRIC RATING
202nd/ 347
METRIC RANK
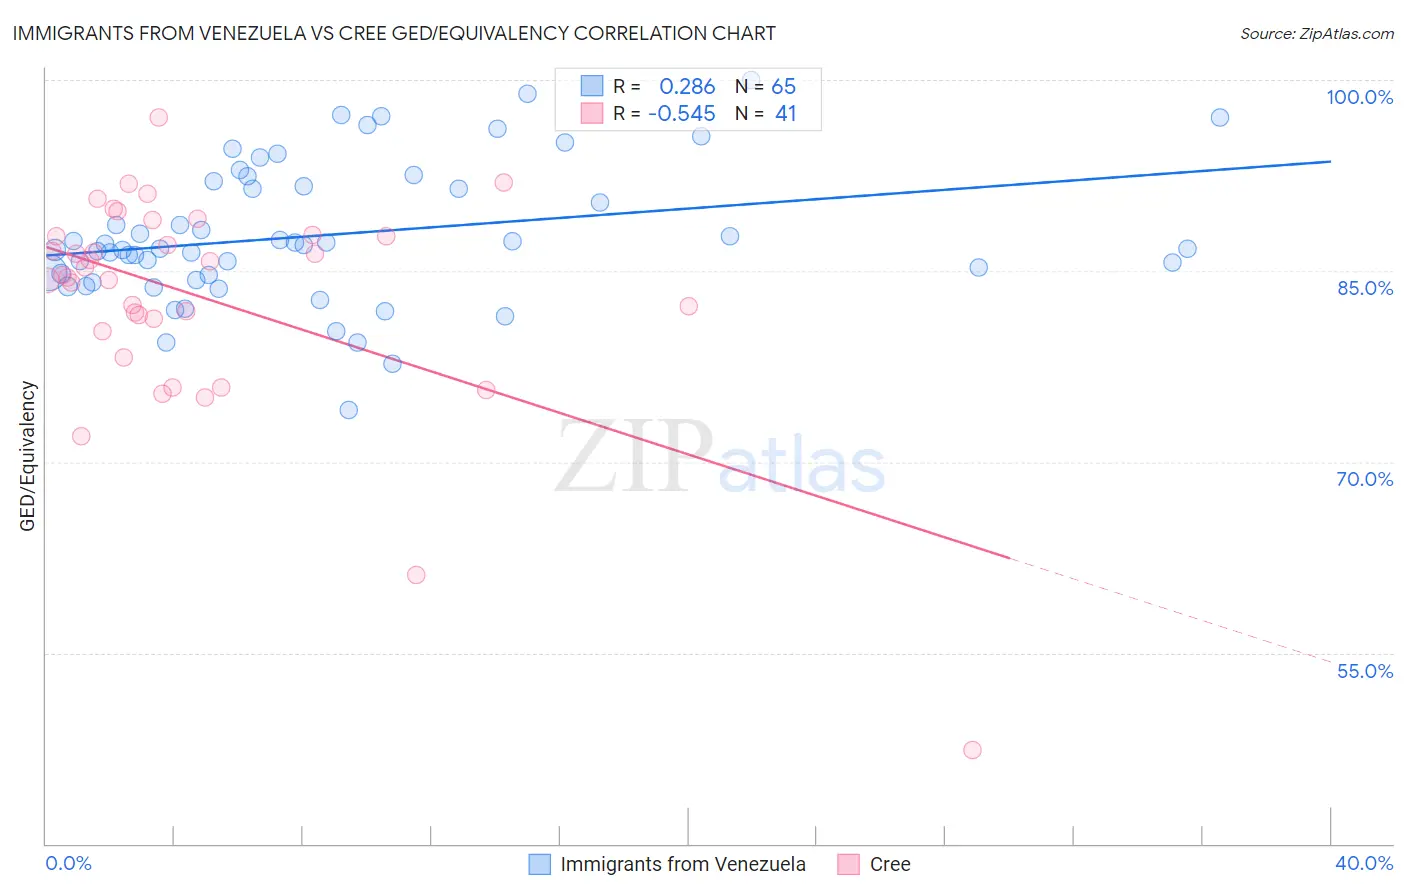
Immigrants from Venezuela vs Cree GED/Equivalency Correlation Chart
The statistical analysis conducted on geographies consisting of 287,866,009 people shows a weak positive correlation between the proportion of Immigrants from Venezuela and percentage of population with at least ged/equivalency education in the United States with a correlation coefficient (R) of 0.286 and weighted average of 85.8%. Similarly, the statistical analysis conducted on geographies consisting of 76,211,744 people shows a substantial negative correlation between the proportion of Cree and percentage of population with at least ged/equivalency education in the United States with a correlation coefficient (R) of -0.545 and weighted average of 85.0%, a difference of 0.88%.
GED/Equivalency Correlation Summary
| Measurement | Immigrants from Venezuela | Cree |
| Minimum | 74.0% | 47.4% |
| Maximum | 100.0% | 97.0% |
| Range | 26.0% | 49.7% |
| Mean | 87.8% | 83.0% |
| Median | 86.8% | 84.7% |
| Interquartile 25% (IQ1) | 84.5% | 80.8% |
| Interquartile 75% (IQ3) | 91.9% | 87.8% |
| Interquartile Range (IQR) | 7.4% | 7.0% |
| Standard Deviation (Sample) | 5.4% | 8.7% |
| Standard Deviation (Population) | 5.4% | 8.5% |
Similar Demographics by GED/Equivalency
Demographics Similar to Immigrants from Venezuela by GED/Equivalency
In terms of ged/equivalency, the demographic groups most similar to Immigrants from Venezuela are Ottawa (85.8%, a difference of 0.010%), Immigrants from Bolivia (85.8%, a difference of 0.020%), Immigrants from Eastern Africa (85.7%, a difference of 0.060%), Bermudan (85.8%, a difference of 0.090%), and Immigrants from Uganda (85.7%, a difference of 0.11%).
| Demographics | Rating | Rank | GED/Equivalency |
| Immigrants | Albania | 64.2 /100 | #166 | Good 86.0% |
| Ethiopians | 63.7 /100 | #167 | Good 86.0% |
| Sierra Leoneans | 61.8 /100 | #168 | Good 86.0% |
| Immigrants | Ethiopia | 61.2 /100 | #169 | Good 86.0% |
| Afghans | 59.7 /100 | #170 | Average 85.9% |
| Immigrants | Chile | 57.3 /100 | #171 | Average 85.9% |
| Bermudans | 55.1 /100 | #172 | Average 85.8% |
| Immigrants | Venezuela | 50.7 /100 | #173 | Average 85.8% |
| Ottawa | 50.0 /100 | #174 | Average 85.8% |
| Immigrants | Bolivia | 49.8 /100 | #175 | Average 85.8% |
| Immigrants | Eastern Africa | 47.7 /100 | #176 | Average 85.7% |
| Immigrants | Uganda | 45.2 /100 | #177 | Average 85.7% |
| Koreans | 41.2 /100 | #178 | Average 85.6% |
| Aleuts | 40.5 /100 | #179 | Average 85.6% |
| Immigrants | Southern Europe | 38.4 /100 | #180 | Fair 85.5% |
Demographics Similar to Cree by GED/Equivalency
In terms of ged/equivalency, the demographic groups most similar to Cree are Portuguese (85.0%, a difference of 0.0%), Uruguayan (85.0%, a difference of 0.010%), Somali (85.0%, a difference of 0.020%), Panamanian (85.0%, a difference of 0.020%), and Hawaiian (85.0%, a difference of 0.030%).
| Demographics | Rating | Rank | GED/Equivalency |
| Chippewa | 20.8 /100 | #195 | Fair 85.2% |
| Tongans | 20.7 /100 | #196 | Fair 85.2% |
| Costa Ricans | 20.4 /100 | #197 | Fair 85.2% |
| Immigrants | Africa | 17.5 /100 | #198 | Poor 85.1% |
| Somalis | 16.4 /100 | #199 | Poor 85.0% |
| Uruguayans | 16.0 /100 | #200 | Poor 85.0% |
| Portuguese | 15.9 /100 | #201 | Poor 85.0% |
| Cree | 15.9 /100 | #202 | Poor 85.0% |
| Panamanians | 15.3 /100 | #203 | Poor 85.0% |
| Hawaiians | 15.2 /100 | #204 | Poor 85.0% |
| Liberians | 14.6 /100 | #205 | Poor 85.0% |
| Samoans | 13.7 /100 | #206 | Poor 84.9% |
| Hmong | 13.1 /100 | #207 | Poor 84.9% |
| Marshallese | 12.5 /100 | #208 | Poor 84.9% |
| Colombians | 12.3 /100 | #209 | Poor 84.9% |