Jordanian vs Irish GED/Equivalency
COMPARE
Jordanian
Irish
GED/Equivalency
GED/Equivalency Comparison
Jordanians
Irish
87.2%
GED/EQUIVALENCY
96.1/ 100
METRIC RATING
103rd/ 347
METRIC RANK
87.6%
GED/EQUIVALENCY
98.6/ 100
METRIC RATING
78th/ 347
METRIC RANK
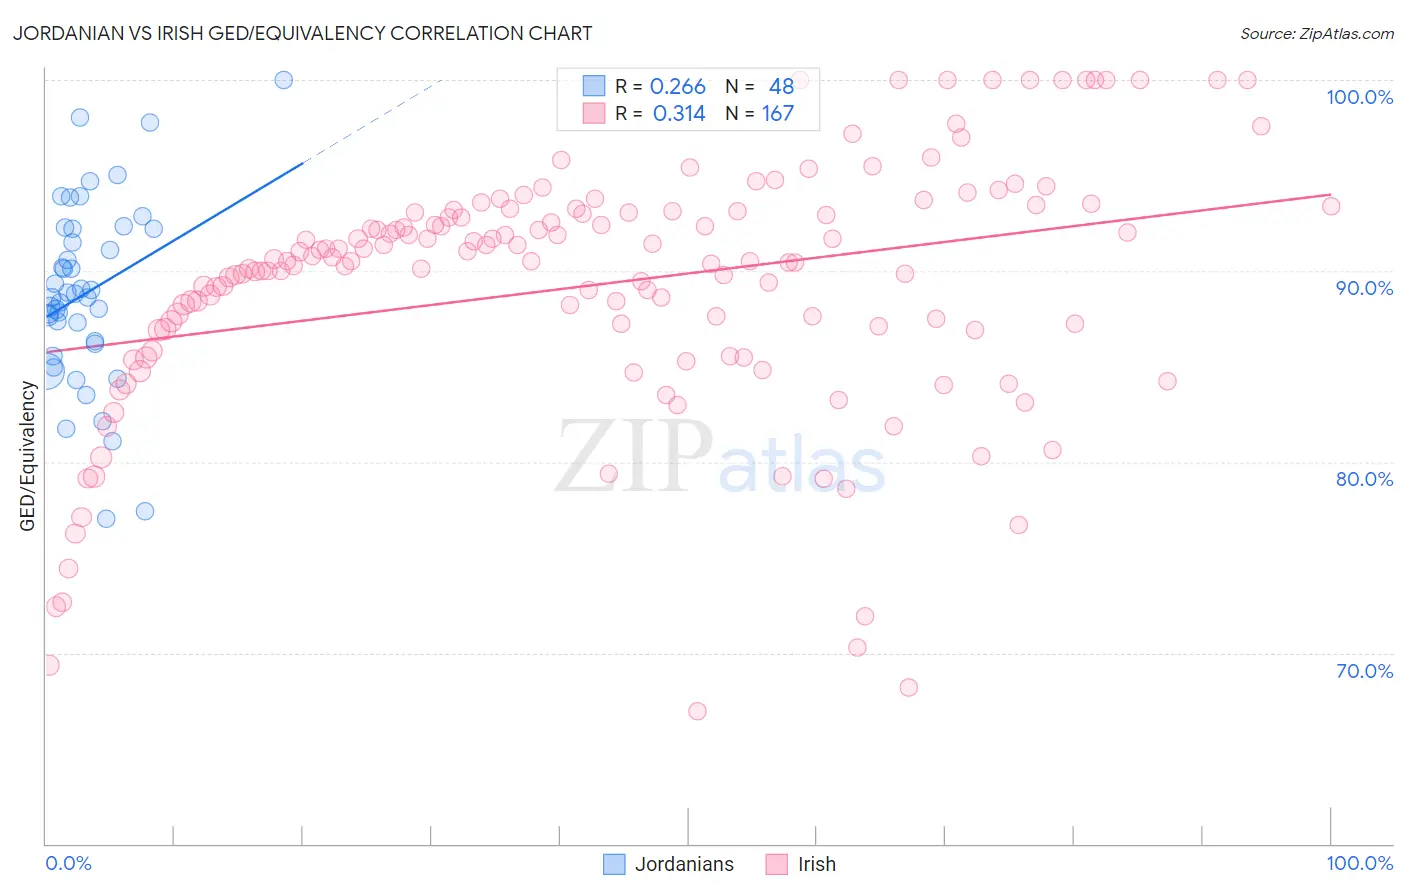
Jordanian vs Irish GED/Equivalency Correlation Chart
The statistical analysis conducted on geographies consisting of 166,422,962 people shows a weak positive correlation between the proportion of Jordanians and percentage of population with at least ged/equivalency education in the United States with a correlation coefficient (R) of 0.266 and weighted average of 87.2%. Similarly, the statistical analysis conducted on geographies consisting of 580,709,357 people shows a mild positive correlation between the proportion of Irish and percentage of population with at least ged/equivalency education in the United States with a correlation coefficient (R) of 0.314 and weighted average of 87.6%, a difference of 0.54%.
GED/Equivalency Correlation Summary
| Measurement | Jordanian | Irish |
| Minimum | 77.0% | 67.0% |
| Maximum | 100.0% | 100.0% |
| Range | 23.0% | 33.0% |
| Mean | 88.8% | 89.2% |
| Median | 88.7% | 90.5% |
| Interquartile 25% (IQ1) | 86.3% | 86.9% |
| Interquartile 75% (IQ3) | 92.2% | 93.1% |
| Interquartile Range (IQR) | 6.0% | 6.2% |
| Standard Deviation (Sample) | 4.8% | 6.6% |
| Standard Deviation (Population) | 4.8% | 6.6% |
Similar Demographics by GED/Equivalency
Demographics Similar to Jordanians by GED/Equivalency
In terms of ged/equivalency, the demographic groups most similar to Jordanians are Lebanese (87.2%, a difference of 0.010%), Immigrants from Hungary (87.2%, a difference of 0.010%), Indian (Asian) (87.1%, a difference of 0.020%), Immigrants from Zimbabwe (87.1%, a difference of 0.040%), and Icelander (87.1%, a difference of 0.050%).
| Demographics | Rating | Rank | GED/Equivalency |
| Czechoslovakians | 97.6 /100 | #96 | Exceptional 87.4% |
| Immigrants | Western Europe | 97.3 /100 | #97 | Exceptional 87.3% |
| Immigrants | Croatia | 96.9 /100 | #98 | Exceptional 87.3% |
| Immigrants | Belarus | 96.9 /100 | #99 | Exceptional 87.3% |
| Palestinians | 96.8 /100 | #100 | Exceptional 87.3% |
| Syrians | 96.6 /100 | #101 | Exceptional 87.2% |
| Lebanese | 96.2 /100 | #102 | Exceptional 87.2% |
| Jordanians | 96.1 /100 | #103 | Exceptional 87.2% |
| Immigrants | Hungary | 96.0 /100 | #104 | Exceptional 87.2% |
| Indians (Asian) | 95.9 /100 | #105 | Exceptional 87.1% |
| Immigrants | Zimbabwe | 95.8 /100 | #106 | Exceptional 87.1% |
| Icelanders | 95.7 /100 | #107 | Exceptional 87.1% |
| Canadians | 95.6 /100 | #108 | Exceptional 87.1% |
| Immigrants | Eastern Europe | 95.5 /100 | #109 | Exceptional 87.1% |
| Egyptians | 95.3 /100 | #110 | Exceptional 87.1% |
Demographics Similar to Irish by GED/Equivalency
In terms of ged/equivalency, the demographic groups most similar to Irish are Slavic (87.7%, a difference of 0.020%), Immigrants from Serbia (87.7%, a difference of 0.030%), English (87.6%, a difference of 0.030%), Scottish (87.7%, a difference of 0.040%), and Immigrants from Kuwait (87.7%, a difference of 0.060%).
| Demographics | Rating | Rank | GED/Equivalency |
| Austrians | 98.8 /100 | #71 | Exceptional 87.7% |
| Immigrants | Moldova | 98.8 /100 | #72 | Exceptional 87.7% |
| Belgians | 98.8 /100 | #73 | Exceptional 87.7% |
| Immigrants | Kuwait | 98.8 /100 | #74 | Exceptional 87.7% |
| Scottish | 98.7 /100 | #75 | Exceptional 87.7% |
| Immigrants | Serbia | 98.7 /100 | #76 | Exceptional 87.7% |
| Slavs | 98.7 /100 | #77 | Exceptional 87.7% |
| Irish | 98.6 /100 | #78 | Exceptional 87.6% |
| English | 98.6 /100 | #79 | Exceptional 87.6% |
| Immigrants | England | 98.5 /100 | #80 | Exceptional 87.6% |
| Immigrants | Sri Lanka | 98.3 /100 | #81 | Exceptional 87.5% |
| Romanians | 98.3 /100 | #82 | Exceptional 87.5% |
| South Africans | 98.3 /100 | #83 | Exceptional 87.5% |
| Immigrants | Romania | 98.1 /100 | #84 | Exceptional 87.5% |
| Dutch | 98.1 /100 | #85 | Exceptional 87.5% |