Albanian vs Immigrants from Australia Associate's Degree
COMPARE
Albanian
Immigrants from Australia
Associate's Degree
Associate's Degree Comparison
Albanians
Immigrants from Australia
48.8%
ASSOCIATE'S DEGREE
94.7/ 100
METRIC RATING
118th/ 347
METRIC RANK
55.8%
ASSOCIATE'S DEGREE
100.0/ 100
METRIC RATING
11th/ 347
METRIC RANK
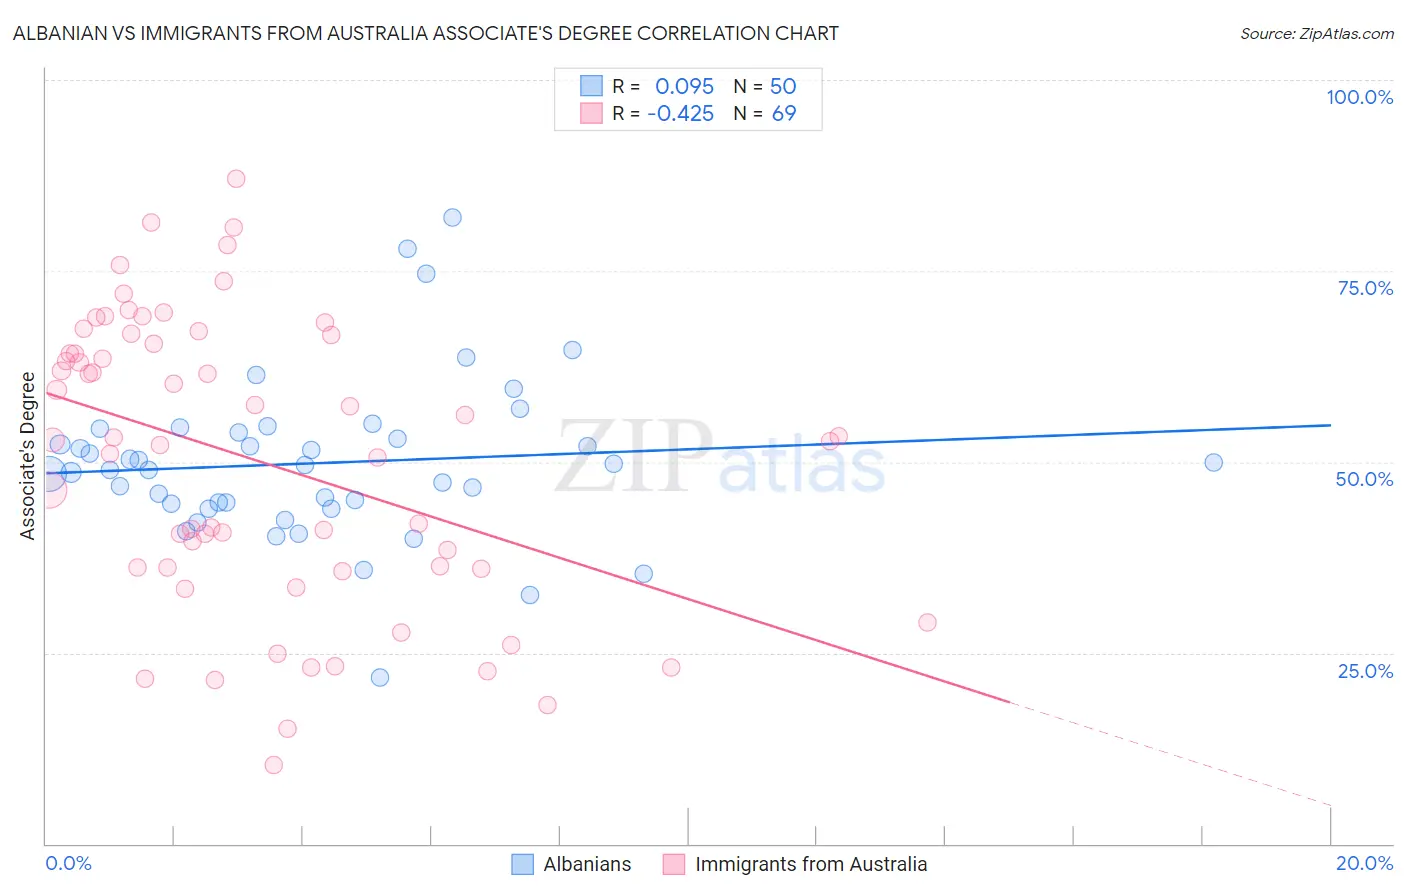
Albanian vs Immigrants from Australia Associate's Degree Correlation Chart
The statistical analysis conducted on geographies consisting of 193,247,791 people shows a slight positive correlation between the proportion of Albanians and percentage of population with at least associate's degree education in the United States with a correlation coefficient (R) of 0.095 and weighted average of 48.8%. Similarly, the statistical analysis conducted on geographies consisting of 227,202,570 people shows a moderate negative correlation between the proportion of Immigrants from Australia and percentage of population with at least associate's degree education in the United States with a correlation coefficient (R) of -0.425 and weighted average of 55.8%, a difference of 14.3%.
Associate's Degree Correlation Summary
| Measurement | Albanian | Immigrants from Australia |
| Minimum | 21.7% | 10.3% |
| Maximum | 82.0% | 87.2% |
| Range | 60.3% | 76.8% |
| Mean | 49.8% | 50.2% |
| Median | 49.3% | 52.9% |
| Interquartile 25% (IQ1) | 44.6% | 36.0% |
| Interquartile 75% (IQ3) | 53.9% | 66.1% |
| Interquartile Range (IQR) | 9.3% | 30.0% |
| Standard Deviation (Sample) | 10.6% | 18.8% |
| Standard Deviation (Population) | 10.5% | 18.7% |
Similar Demographics by Associate's Degree
Demographics Similar to Albanians by Associate's Degree
In terms of associate's degree, the demographic groups most similar to Albanians are Lebanese (48.8%, a difference of 0.010%), Alsatian (48.8%, a difference of 0.030%), Afghan (48.9%, a difference of 0.060%), British (48.9%, a difference of 0.11%), and Luxembourger (48.9%, a difference of 0.17%).
| Demographics | Rating | Rank | Associate's Degree |
| Immigrants | Venezuela | 95.8 /100 | #111 | Exceptional 49.1% |
| Immigrants | Chile | 95.3 /100 | #112 | Exceptional 49.0% |
| Palestinians | 95.3 /100 | #113 | Exceptional 49.0% |
| Arabs | 95.3 /100 | #114 | Exceptional 49.0% |
| Luxembourgers | 95.1 /100 | #115 | Exceptional 48.9% |
| British | 95.0 /100 | #116 | Exceptional 48.9% |
| Afghans | 94.8 /100 | #117 | Exceptional 48.9% |
| Albanians | 94.7 /100 | #118 | Exceptional 48.8% |
| Lebanese | 94.6 /100 | #119 | Exceptional 48.8% |
| Alsatians | 94.6 /100 | #120 | Exceptional 48.8% |
| Ugandans | 93.9 /100 | #121 | Exceptional 48.7% |
| Italians | 93.9 /100 | #122 | Exceptional 48.7% |
| Brazilians | 93.7 /100 | #123 | Exceptional 48.7% |
| Serbians | 92.6 /100 | #124 | Exceptional 48.5% |
| Chinese | 92.5 /100 | #125 | Exceptional 48.5% |
Demographics Similar to Immigrants from Australia by Associate's Degree
In terms of associate's degree, the demographic groups most similar to Immigrants from Australia are Immigrants from South Central Asia (55.7%, a difference of 0.12%), Immigrants from China (55.5%, a difference of 0.61%), Immigrants from Hong Kong (55.4%, a difference of 0.76%), Immigrants from Eastern Asia (55.4%, a difference of 0.79%), and Cypriot (56.4%, a difference of 1.0%).
| Demographics | Rating | Rank | Associate's Degree |
| Immigrants | Taiwan | 100.0 /100 | #4 | Exceptional 58.4% |
| Iranians | 100.0 /100 | #5 | Exceptional 58.2% |
| Okinawans | 100.0 /100 | #6 | Exceptional 57.7% |
| Immigrants | Iran | 100.0 /100 | #7 | Exceptional 57.7% |
| Thais | 100.0 /100 | #8 | Exceptional 57.4% |
| Immigrants | Israel | 100.0 /100 | #9 | Exceptional 56.8% |
| Cypriots | 100.0 /100 | #10 | Exceptional 56.4% |
| Immigrants | Australia | 100.0 /100 | #11 | Exceptional 55.8% |
| Immigrants | South Central Asia | 100.0 /100 | #12 | Exceptional 55.7% |
| Immigrants | China | 100.0 /100 | #13 | Exceptional 55.5% |
| Immigrants | Hong Kong | 100.0 /100 | #14 | Exceptional 55.4% |
| Immigrants | Eastern Asia | 100.0 /100 | #15 | Exceptional 55.4% |
| Soviet Union | 100.0 /100 | #16 | Exceptional 55.1% |
| Eastern Europeans | 100.0 /100 | #17 | Exceptional 55.0% |
| Indians (Asian) | 100.0 /100 | #18 | Exceptional 54.8% |