Immigrants from Ireland vs Immigrants from Australia Associate's Degree
COMPARE
Immigrants from Ireland
Immigrants from Australia
Associate's Degree
Associate's Degree Comparison
Immigrants from Ireland
Immigrants from Australia
54.7%
ASSOCIATE'S DEGREE
100.0/ 100
METRIC RATING
19th/ 347
METRIC RANK
55.8%
ASSOCIATE'S DEGREE
100.0/ 100
METRIC RATING
11th/ 347
METRIC RANK
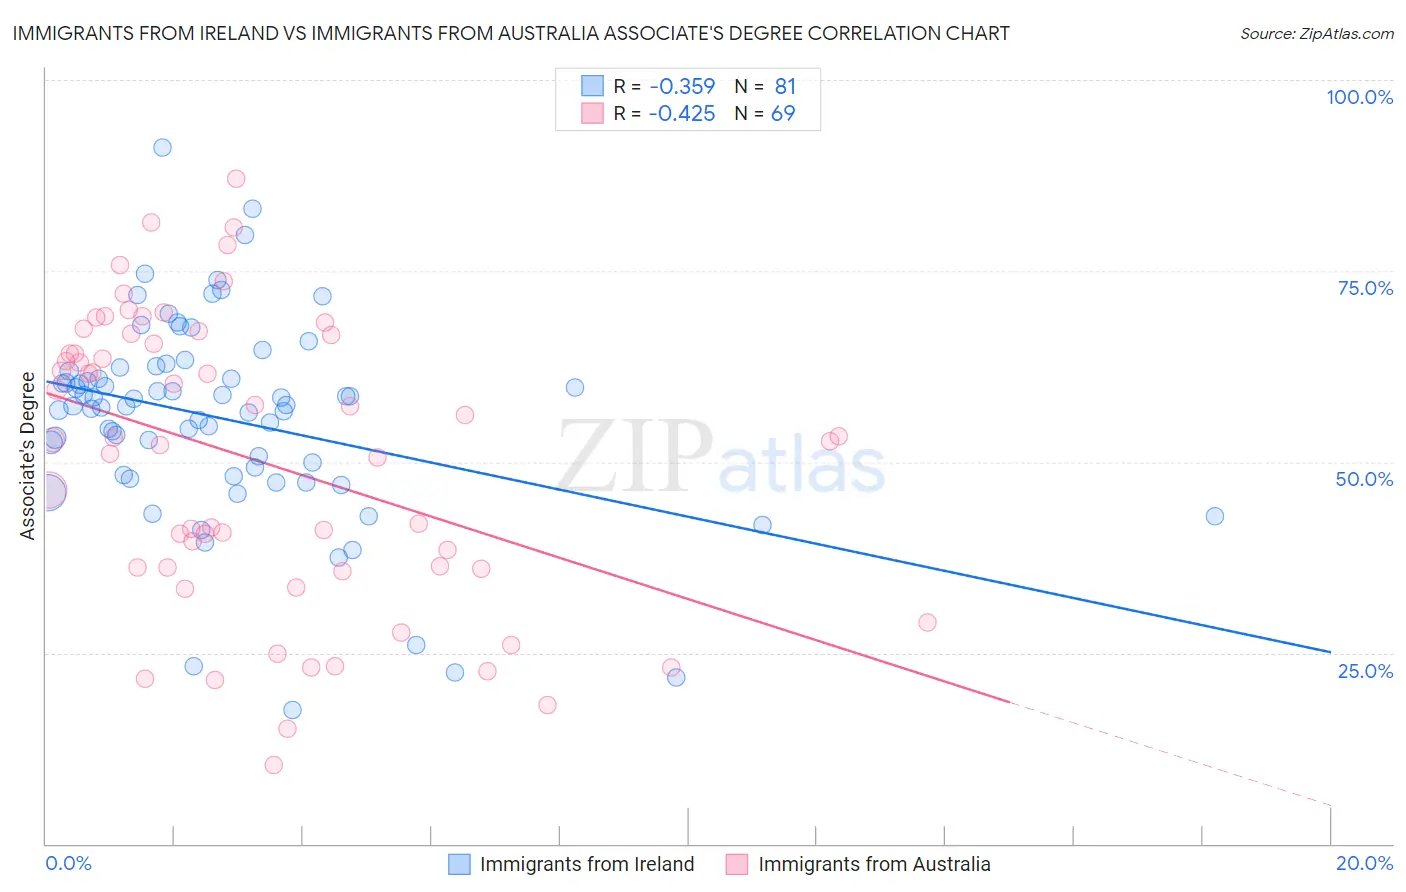
Immigrants from Ireland vs Immigrants from Australia Associate's Degree Correlation Chart
The statistical analysis conducted on geographies consisting of 240,784,302 people shows a mild negative correlation between the proportion of Immigrants from Ireland and percentage of population with at least associate's degree education in the United States with a correlation coefficient (R) of -0.359 and weighted average of 54.7%. Similarly, the statistical analysis conducted on geographies consisting of 227,202,570 people shows a moderate negative correlation between the proportion of Immigrants from Australia and percentage of population with at least associate's degree education in the United States with a correlation coefficient (R) of -0.425 and weighted average of 55.8%, a difference of 2.1%.
Associate's Degree Correlation Summary
| Measurement | Immigrants from Ireland | Immigrants from Australia |
| Minimum | 17.6% | 10.3% |
| Maximum | 91.2% | 87.2% |
| Range | 73.6% | 76.8% |
| Mean | 55.6% | 50.2% |
| Median | 57.4% | 52.9% |
| Interquartile 25% (IQ1) | 48.2% | 36.0% |
| Interquartile 75% (IQ3) | 62.1% | 66.1% |
| Interquartile Range (IQR) | 13.9% | 30.0% |
| Standard Deviation (Sample) | 13.2% | 18.8% |
| Standard Deviation (Population) | 13.1% | 18.7% |
Demographics Similar to Immigrants from Ireland and Immigrants from Australia by Associate's Degree
In terms of associate's degree, the demographic groups most similar to Immigrants from Ireland are Cambodian (54.6%, a difference of 0.020%), Immigrants from Sweden (54.6%, a difference of 0.090%), Immigrants from Japan (54.6%, a difference of 0.12%), Burmese (54.6%, a difference of 0.12%), and Immigrants from Korea (54.5%, a difference of 0.21%). Similarly, the demographic groups most similar to Immigrants from Australia are Immigrants from South Central Asia (55.7%, a difference of 0.12%), Immigrants from China (55.5%, a difference of 0.61%), Immigrants from Hong Kong (55.4%, a difference of 0.76%), Immigrants from Eastern Asia (55.4%, a difference of 0.79%), and Cypriot (56.4%, a difference of 1.0%).
| Demographics | Rating | Rank | Associate's Degree |
| Iranians | 100.0 /100 | #5 | Exceptional 58.2% |
| Okinawans | 100.0 /100 | #6 | Exceptional 57.7% |
| Immigrants | Iran | 100.0 /100 | #7 | Exceptional 57.7% |
| Thais | 100.0 /100 | #8 | Exceptional 57.4% |
| Immigrants | Israel | 100.0 /100 | #9 | Exceptional 56.8% |
| Cypriots | 100.0 /100 | #10 | Exceptional 56.4% |
| Immigrants | Australia | 100.0 /100 | #11 | Exceptional 55.8% |
| Immigrants | South Central Asia | 100.0 /100 | #12 | Exceptional 55.7% |
| Immigrants | China | 100.0 /100 | #13 | Exceptional 55.5% |
| Immigrants | Hong Kong | 100.0 /100 | #14 | Exceptional 55.4% |
| Immigrants | Eastern Asia | 100.0 /100 | #15 | Exceptional 55.4% |
| Soviet Union | 100.0 /100 | #16 | Exceptional 55.1% |
| Eastern Europeans | 100.0 /100 | #17 | Exceptional 55.0% |
| Indians (Asian) | 100.0 /100 | #18 | Exceptional 54.8% |
| Immigrants | Ireland | 100.0 /100 | #19 | Exceptional 54.7% |
| Cambodians | 100.0 /100 | #20 | Exceptional 54.6% |
| Immigrants | Sweden | 100.0 /100 | #21 | Exceptional 54.6% |
| Immigrants | Japan | 100.0 /100 | #22 | Exceptional 54.6% |
| Burmese | 100.0 /100 | #23 | Exceptional 54.6% |
| Immigrants | Korea | 100.0 /100 | #24 | Exceptional 54.5% |
| Immigrants | Switzerland | 100.0 /100 | #25 | Exceptional 54.5% |