Tlingit-Haida vs Immigrants from Australia Associate's Degree
COMPARE
Tlingit-Haida
Immigrants from Australia
Associate's Degree
Associate's Degree Comparison
Tlingit-Haida
Immigrants from Australia
43.0%
ASSOCIATE'S DEGREE
2.1/ 100
METRIC RATING
234th/ 347
METRIC RANK
55.8%
ASSOCIATE'S DEGREE
100.0/ 100
METRIC RATING
11th/ 347
METRIC RANK
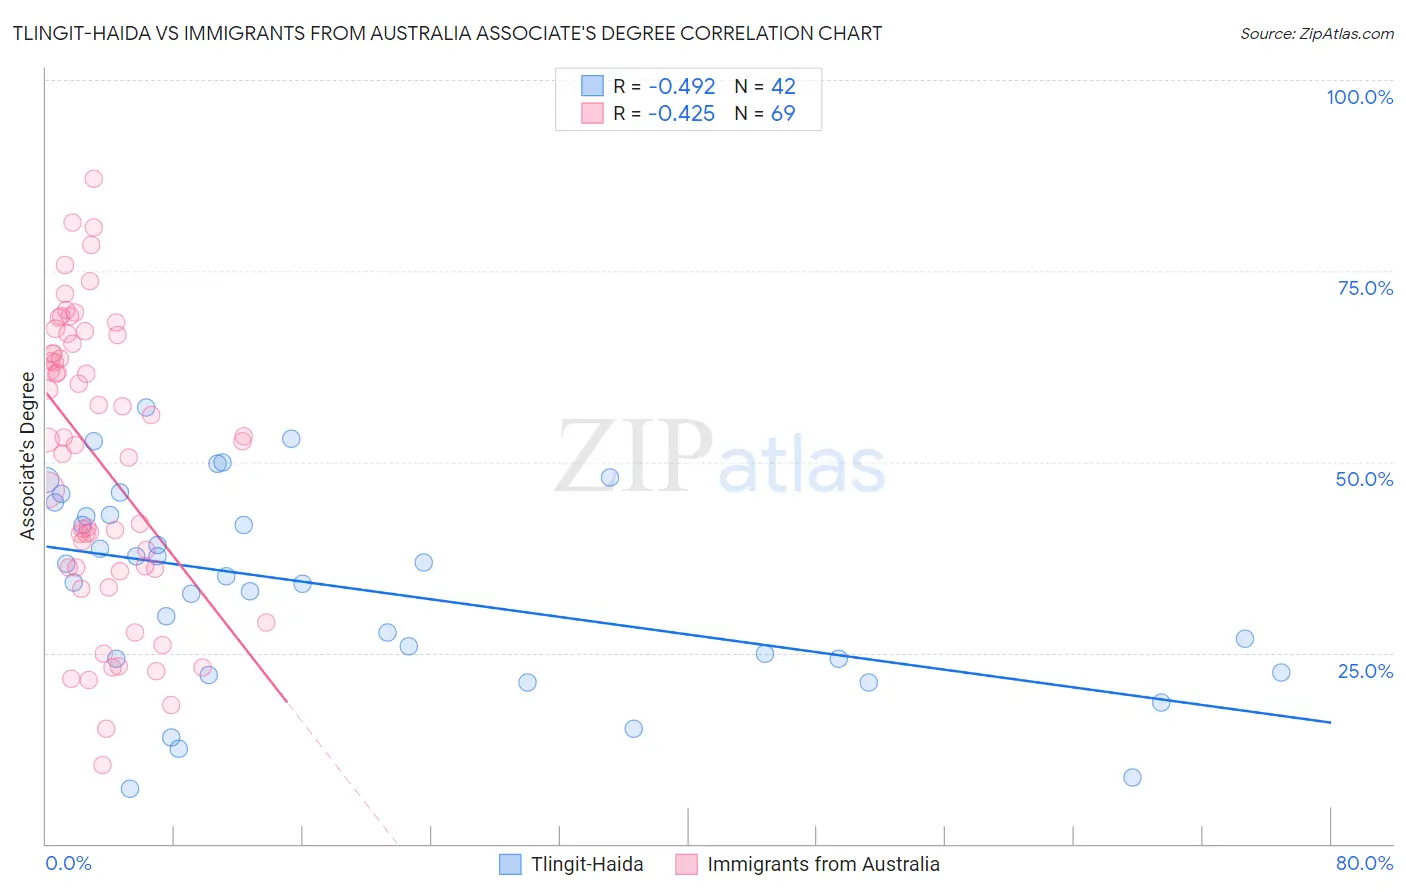
Tlingit-Haida vs Immigrants from Australia Associate's Degree Correlation Chart
The statistical analysis conducted on geographies consisting of 60,872,339 people shows a moderate negative correlation between the proportion of Tlingit-Haida and percentage of population with at least associate's degree education in the United States with a correlation coefficient (R) of -0.492 and weighted average of 43.0%. Similarly, the statistical analysis conducted on geographies consisting of 227,202,570 people shows a moderate negative correlation between the proportion of Immigrants from Australia and percentage of population with at least associate's degree education in the United States with a correlation coefficient (R) of -0.425 and weighted average of 55.8%, a difference of 29.8%.
Associate's Degree Correlation Summary
| Measurement | Tlingit-Haida | Immigrants from Australia |
| Minimum | 7.1% | 10.3% |
| Maximum | 57.1% | 87.2% |
| Range | 50.0% | 76.8% |
| Mean | 33.5% | 50.2% |
| Median | 34.6% | 52.9% |
| Interquartile 25% (IQ1) | 24.2% | 36.0% |
| Interquartile 75% (IQ3) | 43.0% | 66.1% |
| Interquartile Range (IQR) | 18.8% | 30.0% |
| Standard Deviation (Sample) | 12.9% | 18.8% |
| Standard Deviation (Population) | 12.7% | 18.7% |
Similar Demographics by Associate's Degree
Demographics Similar to Tlingit-Haida by Associate's Degree
In terms of associate's degree, the demographic groups most similar to Tlingit-Haida are Tongan (43.0%, a difference of 0.090%), Ecuadorian (43.0%, a difference of 0.090%), Immigrants from St. Vincent and the Grenadines (42.9%, a difference of 0.18%), Nonimmigrants (42.9%, a difference of 0.20%), and Native Hawaiian (43.1%, a difference of 0.25%).
| Demographics | Rating | Rank | Associate's Degree |
| Trinidadians and Tobagonians | 4.0 /100 | #227 | Tragic 43.6% |
| Hmong | 3.2 /100 | #228 | Tragic 43.4% |
| Immigrants | Trinidad and Tobago | 3.0 /100 | #229 | Tragic 43.3% |
| Immigrants | Barbados | 2.9 /100 | #230 | Tragic 43.3% |
| Liberians | 2.9 /100 | #231 | Tragic 43.3% |
| Native Hawaiians | 2.3 /100 | #232 | Tragic 43.1% |
| Tongans | 2.2 /100 | #233 | Tragic 43.0% |
| Tlingit-Haida | 2.1 /100 | #234 | Tragic 43.0% |
| Ecuadorians | 2.0 /100 | #235 | Tragic 43.0% |
| Immigrants | St. Vincent and the Grenadines | 1.9 /100 | #236 | Tragic 42.9% |
| Immigrants | Nonimmigrants | 1.9 /100 | #237 | Tragic 42.9% |
| Iroquois | 1.7 /100 | #238 | Tragic 42.8% |
| Immigrants | Grenada | 1.3 /100 | #239 | Tragic 42.6% |
| Cree | 1.2 /100 | #240 | Tragic 42.5% |
| British West Indians | 1.0 /100 | #241 | Tragic 42.4% |
Demographics Similar to Immigrants from Australia by Associate's Degree
In terms of associate's degree, the demographic groups most similar to Immigrants from Australia are Immigrants from South Central Asia (55.7%, a difference of 0.12%), Immigrants from China (55.5%, a difference of 0.61%), Immigrants from Hong Kong (55.4%, a difference of 0.76%), Immigrants from Eastern Asia (55.4%, a difference of 0.79%), and Cypriot (56.4%, a difference of 1.0%).
| Demographics | Rating | Rank | Associate's Degree |
| Immigrants | Taiwan | 100.0 /100 | #4 | Exceptional 58.4% |
| Iranians | 100.0 /100 | #5 | Exceptional 58.2% |
| Okinawans | 100.0 /100 | #6 | Exceptional 57.7% |
| Immigrants | Iran | 100.0 /100 | #7 | Exceptional 57.7% |
| Thais | 100.0 /100 | #8 | Exceptional 57.4% |
| Immigrants | Israel | 100.0 /100 | #9 | Exceptional 56.8% |
| Cypriots | 100.0 /100 | #10 | Exceptional 56.4% |
| Immigrants | Australia | 100.0 /100 | #11 | Exceptional 55.8% |
| Immigrants | South Central Asia | 100.0 /100 | #12 | Exceptional 55.7% |
| Immigrants | China | 100.0 /100 | #13 | Exceptional 55.5% |
| Immigrants | Hong Kong | 100.0 /100 | #14 | Exceptional 55.4% |
| Immigrants | Eastern Asia | 100.0 /100 | #15 | Exceptional 55.4% |
| Soviet Union | 100.0 /100 | #16 | Exceptional 55.1% |
| Eastern Europeans | 100.0 /100 | #17 | Exceptional 55.0% |
| Indians (Asian) | 100.0 /100 | #18 | Exceptional 54.8% |