Jamaican vs Immigrants from Guatemala GED/Equivalency
COMPARE
Jamaican
Immigrants from Guatemala
GED/Equivalency
GED/Equivalency Comparison
Jamaicans
Immigrants from Guatemala
83.3%
GED/EQUIVALENCY
0.4/ 100
METRIC RATING
257th/ 347
METRIC RANK
77.9%
GED/EQUIVALENCY
0.0/ 100
METRIC RATING
338th/ 347
METRIC RANK
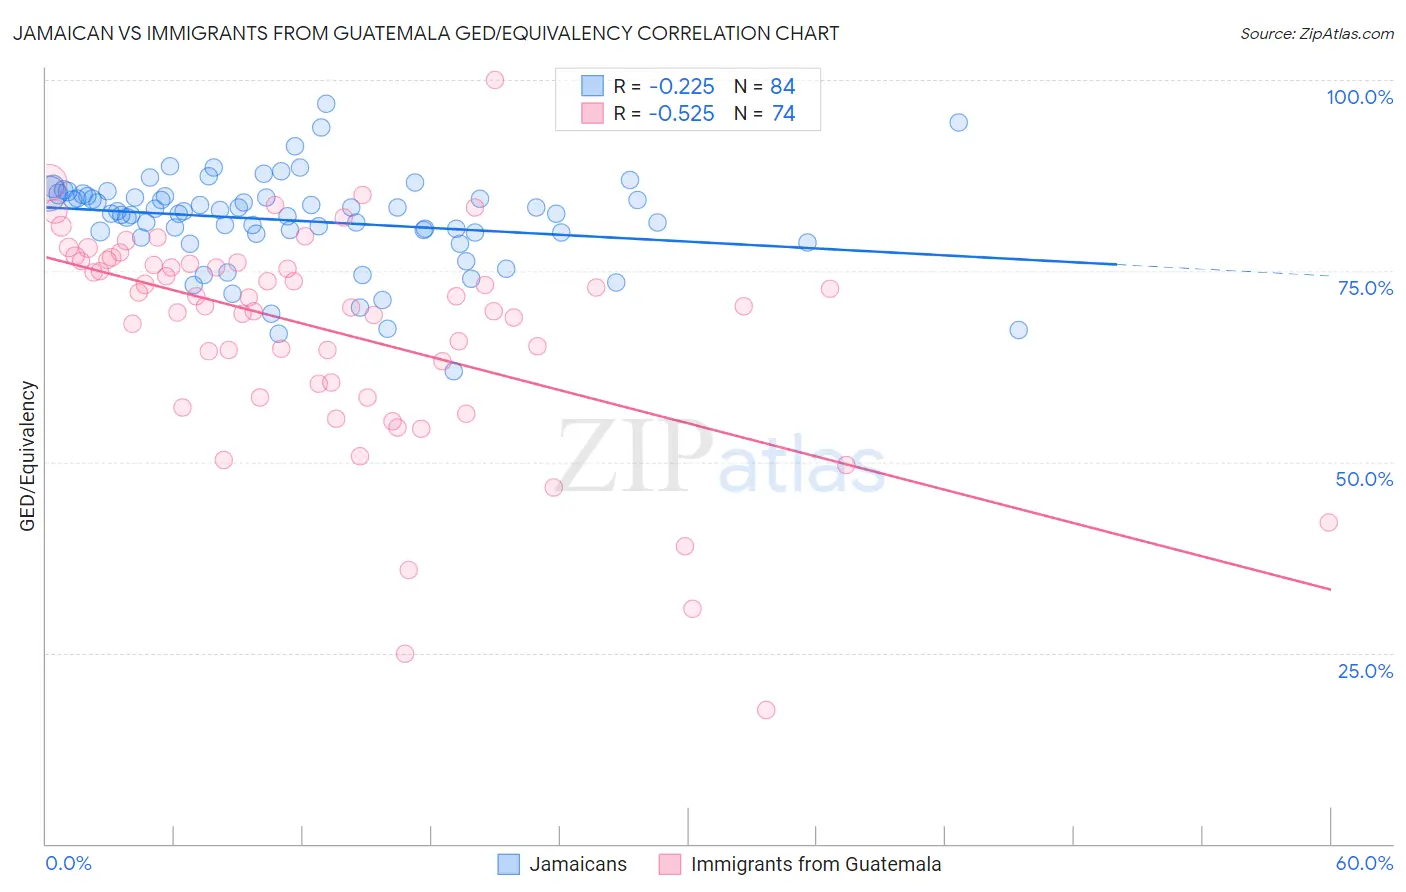
Jamaican vs Immigrants from Guatemala GED/Equivalency Correlation Chart
The statistical analysis conducted on geographies consisting of 368,084,562 people shows a weak negative correlation between the proportion of Jamaicans and percentage of population with at least ged/equivalency education in the United States with a correlation coefficient (R) of -0.225 and weighted average of 83.3%. Similarly, the statistical analysis conducted on geographies consisting of 377,286,142 people shows a substantial negative correlation between the proportion of Immigrants from Guatemala and percentage of population with at least ged/equivalency education in the United States with a correlation coefficient (R) of -0.525 and weighted average of 77.9%, a difference of 6.9%.
GED/Equivalency Correlation Summary
| Measurement | Jamaican | Immigrants from Guatemala |
| Minimum | 61.9% | 17.4% |
| Maximum | 96.9% | 100.0% |
| Range | 35.0% | 82.6% |
| Mean | 81.6% | 67.2% |
| Median | 82.7% | 71.0% |
| Interquartile 25% (IQ1) | 80.0% | 60.2% |
| Interquartile 75% (IQ3) | 84.8% | 76.1% |
| Interquartile Range (IQR) | 4.8% | 15.9% |
| Standard Deviation (Sample) | 6.2% | 14.6% |
| Standard Deviation (Population) | 6.1% | 14.5% |
Similar Demographics by GED/Equivalency
Demographics Similar to Jamaicans by GED/Equivalency
In terms of ged/equivalency, the demographic groups most similar to Jamaicans are Malaysian (83.3%, a difference of 0.030%), African (83.4%, a difference of 0.13%), Colville (83.4%, a difference of 0.14%), Immigrants from Vietnam (83.2%, a difference of 0.17%), and Choctaw (83.1%, a difference of 0.20%).
| Demographics | Rating | Rank | GED/Equivalency |
| Shoshone | 1.0 /100 | #250 | Tragic 83.7% |
| Spanish Americans | 0.8 /100 | #251 | Tragic 83.6% |
| Bahamians | 0.8 /100 | #252 | Tragic 83.6% |
| Comanche | 0.7 /100 | #253 | Tragic 83.6% |
| Creek | 0.7 /100 | #254 | Tragic 83.6% |
| Colville | 0.5 /100 | #255 | Tragic 83.4% |
| Africans | 0.5 /100 | #256 | Tragic 83.4% |
| Jamaicans | 0.4 /100 | #257 | Tragic 83.3% |
| Malaysians | 0.4 /100 | #258 | Tragic 83.3% |
| Immigrants | Vietnam | 0.3 /100 | #259 | Tragic 83.2% |
| Choctaw | 0.3 /100 | #260 | Tragic 83.1% |
| Inupiat | 0.2 /100 | #261 | Tragic 83.1% |
| Immigrants | Armenia | 0.2 /100 | #262 | Tragic 83.1% |
| Immigrants | Congo | 0.2 /100 | #263 | Tragic 83.1% |
| Bangladeshis | 0.2 /100 | #264 | Tragic 83.1% |
Demographics Similar to Immigrants from Guatemala by GED/Equivalency
In terms of ged/equivalency, the demographic groups most similar to Immigrants from Guatemala are Immigrants from Yemen (77.9%, a difference of 0.020%), Immigrants from Dominican Republic (78.0%, a difference of 0.090%), Immigrants from El Salvador (77.6%, a difference of 0.38%), Tohono O'odham (77.5%, a difference of 0.54%), and Mexican (77.4%, a difference of 0.63%).
| Demographics | Rating | Rank | GED/Equivalency |
| Immigrants | Honduras | 0.0 /100 | #331 | Tragic 78.7% |
| Immigrants | Azores | 0.0 /100 | #332 | Tragic 78.7% |
| Salvadorans | 0.0 /100 | #333 | Tragic 78.6% |
| Guatemalans | 0.0 /100 | #334 | Tragic 78.5% |
| Immigrants | Latin America | 0.0 /100 | #335 | Tragic 78.5% |
| Immigrants | Dominican Republic | 0.0 /100 | #336 | Tragic 78.0% |
| Immigrants | Yemen | 0.0 /100 | #337 | Tragic 77.9% |
| Immigrants | Guatemala | 0.0 /100 | #338 | Tragic 77.9% |
| Immigrants | El Salvador | 0.0 /100 | #339 | Tragic 77.6% |
| Tohono O'odham | 0.0 /100 | #340 | Tragic 77.5% |
| Mexicans | 0.0 /100 | #341 | Tragic 77.4% |
| Pima | 0.0 /100 | #342 | Tragic 76.4% |
| Immigrants | Central America | 0.0 /100 | #343 | Tragic 76.4% |
| Spanish American Indians | 0.0 /100 | #344 | Tragic 76.3% |
| Immigrants | Mexico | 0.0 /100 | #345 | Tragic 75.7% |