Jamaican vs Immigrants from Somalia 2nd Grade
COMPARE
Jamaican
Immigrants from Somalia
2nd Grade
2nd Grade Comparison
Jamaicans
Immigrants from Somalia
97.5%
2ND GRADE
0.6/ 100
METRIC RATING
256th/ 347
METRIC RANK
96.9%
2ND GRADE
0.0/ 100
METRIC RATING
306th/ 347
METRIC RANK
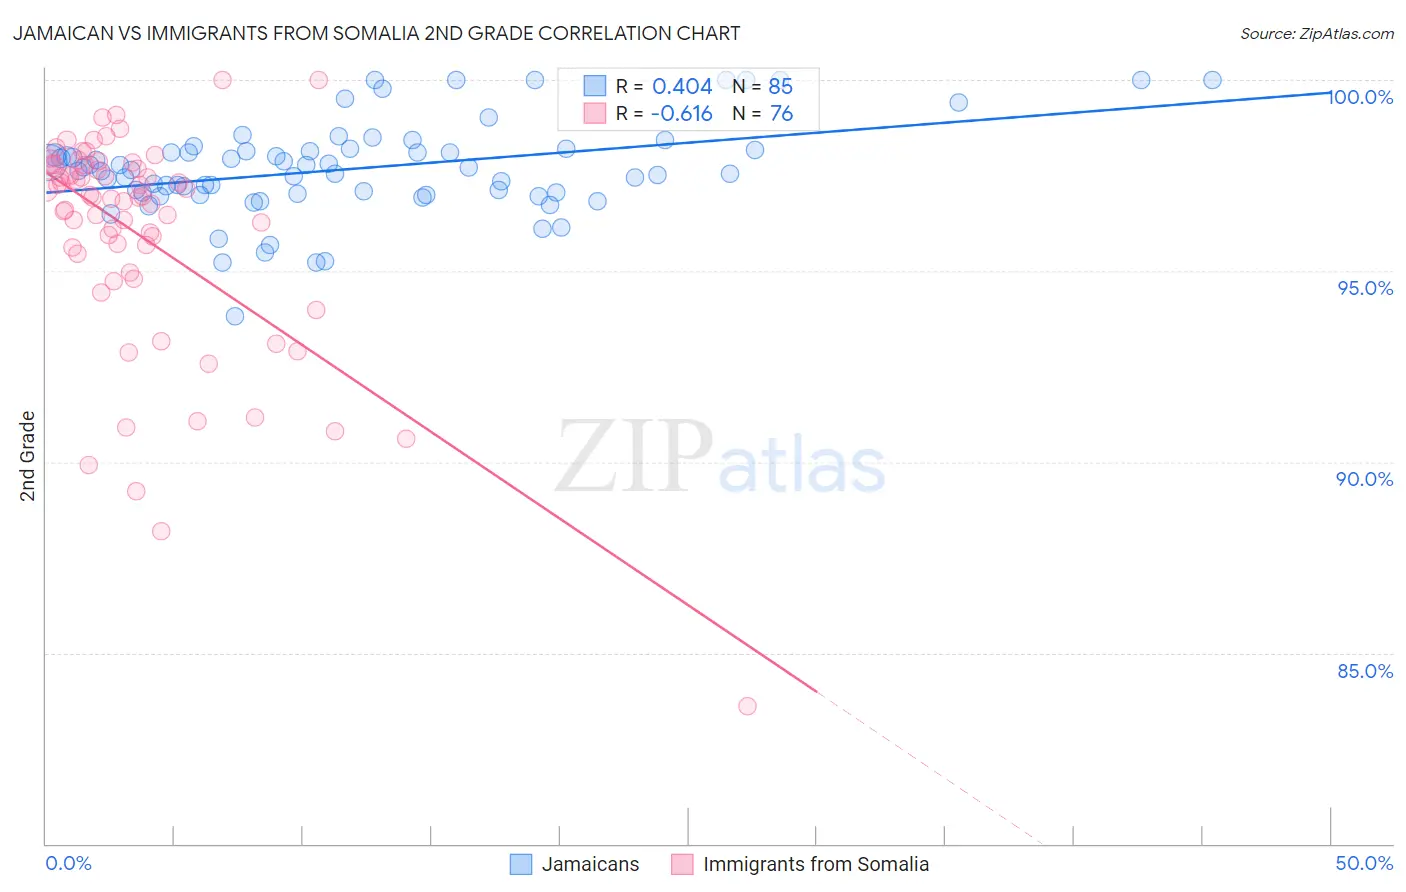
Jamaican vs Immigrants from Somalia 2nd Grade Correlation Chart
The statistical analysis conducted on geographies consisting of 368,084,732 people shows a moderate positive correlation between the proportion of Jamaicans and percentage of population with at least 2nd grade education in the United States with a correlation coefficient (R) of 0.404 and weighted average of 97.5%. Similarly, the statistical analysis conducted on geographies consisting of 92,111,755 people shows a significant negative correlation between the proportion of Immigrants from Somalia and percentage of population with at least 2nd grade education in the United States with a correlation coefficient (R) of -0.616 and weighted average of 96.9%, a difference of 0.61%.
2nd Grade Correlation Summary
| Measurement | Jamaican | Immigrants from Somalia |
| Minimum | 93.8% | 83.6% |
| Maximum | 100.0% | 100.0% |
| Range | 6.2% | 16.4% |
| Mean | 97.7% | 95.9% |
| Median | 97.7% | 96.9% |
| Interquartile 25% (IQ1) | 97.0% | 95.2% |
| Interquartile 75% (IQ3) | 98.2% | 97.8% |
| Interquartile Range (IQR) | 1.1% | 2.6% |
| Standard Deviation (Sample) | 1.2% | 2.9% |
| Standard Deviation (Population) | 1.2% | 2.9% |
Similar Demographics by 2nd Grade
Demographics Similar to Jamaicans by 2nd Grade
In terms of 2nd grade, the demographic groups most similar to Jamaicans are Indian (Asian) (97.5%, a difference of 0.0%), Immigrants from Congo (97.5%, a difference of 0.0%), Immigrants from Colombia (97.5%, a difference of 0.0%), Yaqui (97.5%, a difference of 0.010%), and Fijian (97.5%, a difference of 0.010%).
| Demographics | Rating | Rank | 2nd Grade |
| Bolivians | 0.9 /100 | #249 | Tragic 97.5% |
| Peruvians | 0.9 /100 | #250 | Tragic 97.5% |
| Immigrants | Africa | 0.8 /100 | #251 | Tragic 97.5% |
| Immigrants | Asia | 0.7 /100 | #252 | Tragic 97.5% |
| Puerto Ricans | 0.7 /100 | #253 | Tragic 97.5% |
| Indians (Asian) | 0.6 /100 | #254 | Tragic 97.5% |
| Immigrants | Congo | 0.6 /100 | #255 | Tragic 97.5% |
| Jamaicans | 0.6 /100 | #256 | Tragic 97.5% |
| Immigrants | Colombia | 0.5 /100 | #257 | Tragic 97.5% |
| Yaqui | 0.5 /100 | #258 | Tragic 97.5% |
| Fijians | 0.5 /100 | #259 | Tragic 97.5% |
| Assyrians/Chaldeans/Syriacs | 0.5 /100 | #260 | Tragic 97.5% |
| Armenians | 0.5 /100 | #261 | Tragic 97.5% |
| Taiwanese | 0.4 /100 | #262 | Tragic 97.4% |
| Immigrants | Ethiopia | 0.4 /100 | #263 | Tragic 97.4% |
Demographics Similar to Immigrants from Somalia by 2nd Grade
In terms of 2nd grade, the demographic groups most similar to Immigrants from Somalia are Nicaraguan (96.9%, a difference of 0.020%), Immigrants from the Azores (96.8%, a difference of 0.030%), Ecuadorian (96.9%, a difference of 0.040%), Immigrants from Caribbean (96.9%, a difference of 0.040%), and Immigrants from Haiti (96.8%, a difference of 0.040%).
| Demographics | Rating | Rank | 2nd Grade |
| Haitians | 0.0 /100 | #299 | Tragic 97.0% |
| Immigrants | South Eastern Asia | 0.0 /100 | #300 | Tragic 97.0% |
| Central American Indians | 0.0 /100 | #301 | Tragic 97.0% |
| Somalis | 0.0 /100 | #302 | Tragic 97.0% |
| Ecuadorians | 0.0 /100 | #303 | Tragic 96.9% |
| Immigrants | Caribbean | 0.0 /100 | #304 | Tragic 96.9% |
| Nicaraguans | 0.0 /100 | #305 | Tragic 96.9% |
| Immigrants | Somalia | 0.0 /100 | #306 | Tragic 96.9% |
| Immigrants | Azores | 0.0 /100 | #307 | Tragic 96.8% |
| Immigrants | Haiti | 0.0 /100 | #308 | Tragic 96.8% |
| Belizeans | 0.0 /100 | #309 | Tragic 96.8% |
| Sri Lankans | 0.0 /100 | #310 | Tragic 96.8% |
| Guyanese | 0.0 /100 | #311 | Tragic 96.8% |
| Cape Verdeans | 0.0 /100 | #312 | Tragic 96.8% |
| Hispanics or Latinos | 0.0 /100 | #313 | Tragic 96.8% |