Jamaican vs Immigrants from Belize GED/Equivalency
COMPARE
Jamaican
Immigrants from Belize
GED/Equivalency
GED/Equivalency Comparison
Jamaicans
Immigrants from Belize
83.3%
GED/EQUIVALENCY
0.4/ 100
METRIC RATING
257th/ 347
METRIC RANK
80.5%
GED/EQUIVALENCY
0.0/ 100
METRIC RATING
319th/ 347
METRIC RANK
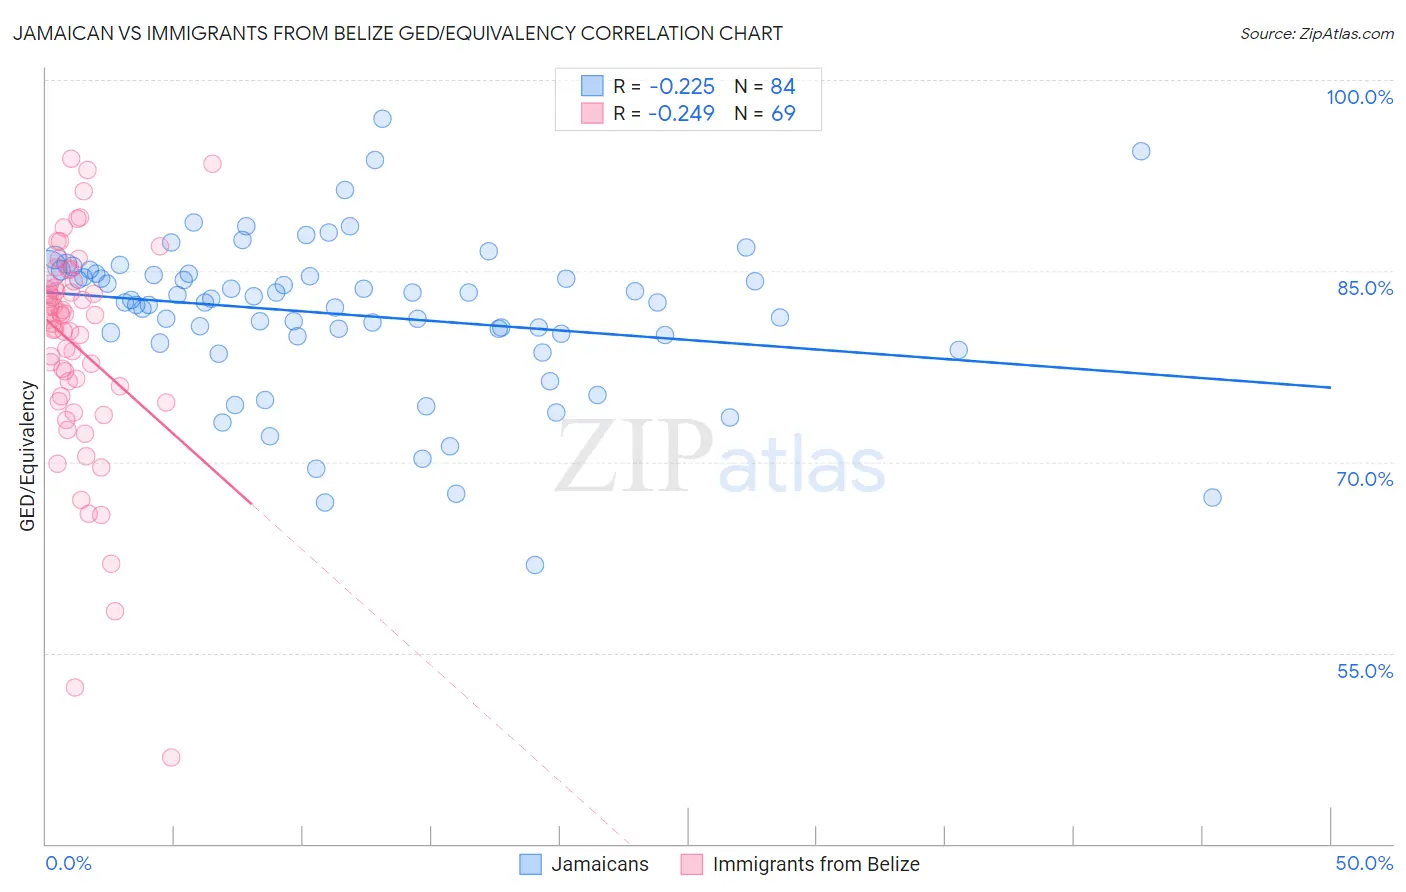
Jamaican vs Immigrants from Belize GED/Equivalency Correlation Chart
The statistical analysis conducted on geographies consisting of 368,084,562 people shows a weak negative correlation between the proportion of Jamaicans and percentage of population with at least ged/equivalency education in the United States with a correlation coefficient (R) of -0.225 and weighted average of 83.3%. Similarly, the statistical analysis conducted on geographies consisting of 130,250,151 people shows a weak negative correlation between the proportion of Immigrants from Belize and percentage of population with at least ged/equivalency education in the United States with a correlation coefficient (R) of -0.249 and weighted average of 80.5%, a difference of 3.5%.
GED/Equivalency Correlation Summary
| Measurement | Jamaican | Immigrants from Belize |
| Minimum | 61.9% | 46.8% |
| Maximum | 96.9% | 93.8% |
| Range | 35.0% | 47.0% |
| Mean | 81.6% | 79.0% |
| Median | 82.7% | 81.2% |
| Interquartile 25% (IQ1) | 80.0% | 75.0% |
| Interquartile 75% (IQ3) | 84.8% | 83.8% |
| Interquartile Range (IQR) | 4.8% | 8.9% |
| Standard Deviation (Sample) | 6.2% | 8.8% |
| Standard Deviation (Population) | 6.1% | 8.7% |
Similar Demographics by GED/Equivalency
Demographics Similar to Jamaicans by GED/Equivalency
In terms of ged/equivalency, the demographic groups most similar to Jamaicans are Malaysian (83.3%, a difference of 0.030%), African (83.4%, a difference of 0.13%), Colville (83.4%, a difference of 0.14%), Immigrants from Vietnam (83.2%, a difference of 0.17%), and Choctaw (83.1%, a difference of 0.20%).
| Demographics | Rating | Rank | GED/Equivalency |
| Shoshone | 1.0 /100 | #250 | Tragic 83.7% |
| Spanish Americans | 0.8 /100 | #251 | Tragic 83.6% |
| Bahamians | 0.8 /100 | #252 | Tragic 83.6% |
| Comanche | 0.7 /100 | #253 | Tragic 83.6% |
| Creek | 0.7 /100 | #254 | Tragic 83.6% |
| Colville | 0.5 /100 | #255 | Tragic 83.4% |
| Africans | 0.5 /100 | #256 | Tragic 83.4% |
| Jamaicans | 0.4 /100 | #257 | Tragic 83.3% |
| Malaysians | 0.4 /100 | #258 | Tragic 83.3% |
| Immigrants | Vietnam | 0.3 /100 | #259 | Tragic 83.2% |
| Choctaw | 0.3 /100 | #260 | Tragic 83.1% |
| Inupiat | 0.2 /100 | #261 | Tragic 83.1% |
| Immigrants | Armenia | 0.2 /100 | #262 | Tragic 83.1% |
| Immigrants | Congo | 0.2 /100 | #263 | Tragic 83.1% |
| Bangladeshis | 0.2 /100 | #264 | Tragic 83.1% |
Demographics Similar to Immigrants from Belize by GED/Equivalency
In terms of ged/equivalency, the demographic groups most similar to Immigrants from Belize are Yaqui (80.5%, a difference of 0.0%), Immigrants from Caribbean (80.5%, a difference of 0.020%), Central American Indian (80.6%, a difference of 0.13%), Apache (80.7%, a difference of 0.26%), and Immigrants from Cuba (80.2%, a difference of 0.41%).
| Demographics | Rating | Rank | GED/Equivalency |
| Nicaraguans | 0.0 /100 | #312 | Tragic 80.9% |
| Cape Verdeans | 0.0 /100 | #313 | Tragic 80.9% |
| Belizeans | 0.0 /100 | #314 | Tragic 80.9% |
| Apache | 0.0 /100 | #315 | Tragic 80.7% |
| Central American Indians | 0.0 /100 | #316 | Tragic 80.6% |
| Immigrants | Caribbean | 0.0 /100 | #317 | Tragic 80.5% |
| Yaqui | 0.0 /100 | #318 | Tragic 80.5% |
| Immigrants | Belize | 0.0 /100 | #319 | Tragic 80.5% |
| Immigrants | Cuba | 0.0 /100 | #320 | Tragic 80.2% |
| Yup'ik | 0.0 /100 | #321 | Tragic 80.0% |
| Lumbee | 0.0 /100 | #322 | Tragic 80.0% |
| Immigrants | Nicaragua | 0.0 /100 | #323 | Tragic 79.9% |
| Mexican American Indians | 0.0 /100 | #324 | Tragic 79.4% |
| Hondurans | 0.0 /100 | #325 | Tragic 79.3% |
| Yuman | 0.0 /100 | #326 | Tragic 79.2% |