Jamaican vs Immigrants from Switzerland GED/Equivalency
COMPARE
Jamaican
Immigrants from Switzerland
GED/Equivalency
GED/Equivalency Comparison
Jamaicans
Immigrants from Switzerland
83.3%
GED/EQUIVALENCY
0.4/ 100
METRIC RATING
257th/ 347
METRIC RANK
88.1%
GED/EQUIVALENCY
99.5/ 100
METRIC RATING
46th/ 347
METRIC RANK
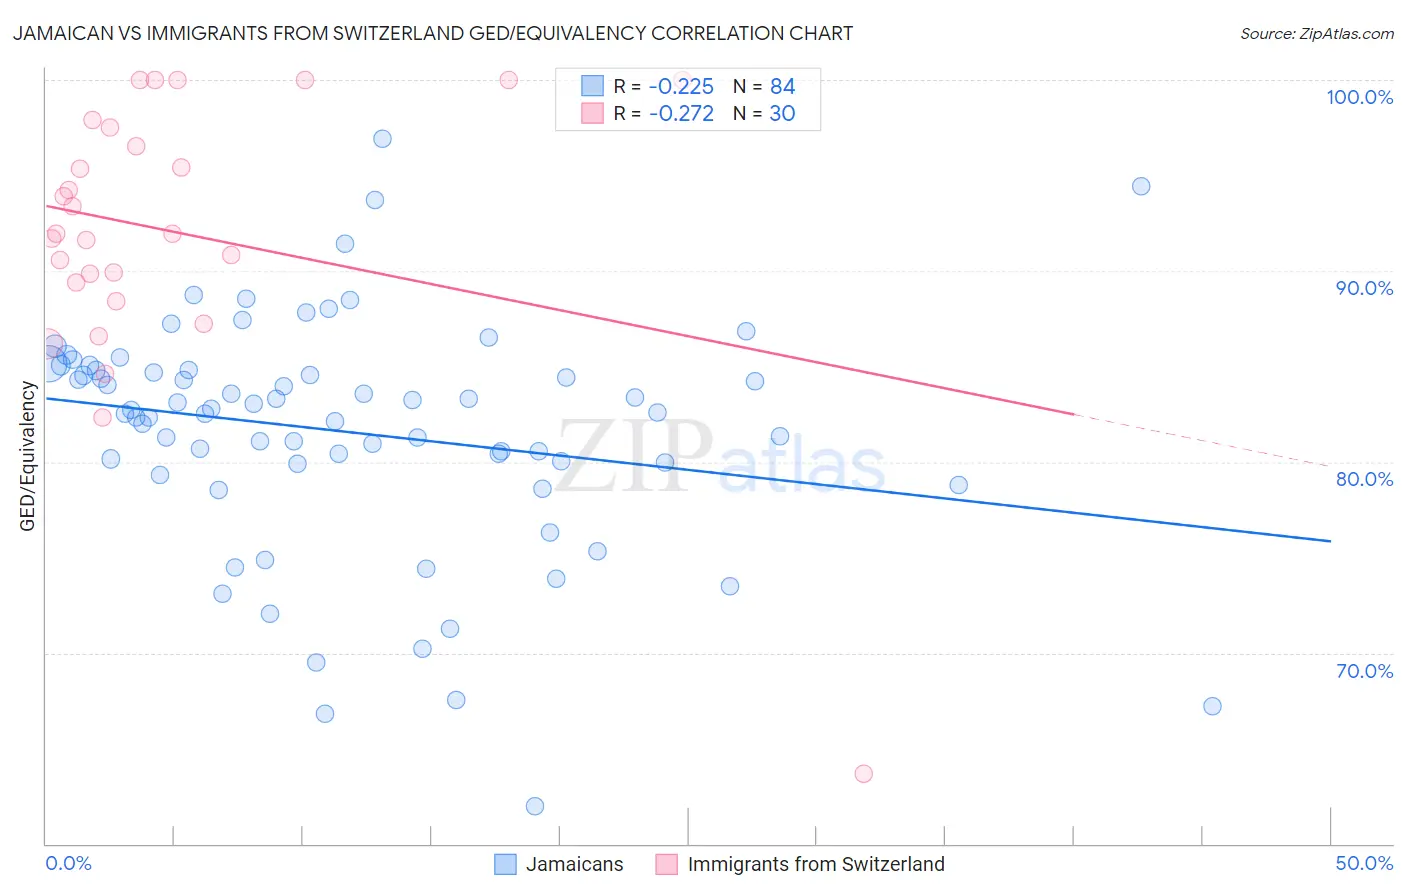
Jamaican vs Immigrants from Switzerland GED/Equivalency Correlation Chart
The statistical analysis conducted on geographies consisting of 368,084,562 people shows a weak negative correlation between the proportion of Jamaicans and percentage of population with at least ged/equivalency education in the United States with a correlation coefficient (R) of -0.225 and weighted average of 83.3%. Similarly, the statistical analysis conducted on geographies consisting of 148,083,583 people shows a weak negative correlation between the proportion of Immigrants from Switzerland and percentage of population with at least ged/equivalency education in the United States with a correlation coefficient (R) of -0.272 and weighted average of 88.1%, a difference of 5.8%.
GED/Equivalency Correlation Summary
| Measurement | Jamaican | Immigrants from Switzerland |
| Minimum | 61.9% | 63.6% |
| Maximum | 96.9% | 100.0% |
| Range | 35.0% | 36.4% |
| Mean | 81.6% | 92.0% |
| Median | 82.7% | 92.0% |
| Interquartile 25% (IQ1) | 80.0% | 89.4% |
| Interquartile 75% (IQ3) | 84.8% | 97.5% |
| Interquartile Range (IQR) | 4.8% | 8.2% |
| Standard Deviation (Sample) | 6.2% | 7.4% |
| Standard Deviation (Population) | 6.1% | 7.2% |
Similar Demographics by GED/Equivalency
Demographics Similar to Jamaicans by GED/Equivalency
In terms of ged/equivalency, the demographic groups most similar to Jamaicans are Malaysian (83.3%, a difference of 0.030%), African (83.4%, a difference of 0.13%), Colville (83.4%, a difference of 0.14%), Immigrants from Vietnam (83.2%, a difference of 0.17%), and Choctaw (83.1%, a difference of 0.20%).
| Demographics | Rating | Rank | GED/Equivalency |
| Shoshone | 1.0 /100 | #250 | Tragic 83.7% |
| Spanish Americans | 0.8 /100 | #251 | Tragic 83.6% |
| Bahamians | 0.8 /100 | #252 | Tragic 83.6% |
| Comanche | 0.7 /100 | #253 | Tragic 83.6% |
| Creek | 0.7 /100 | #254 | Tragic 83.6% |
| Colville | 0.5 /100 | #255 | Tragic 83.4% |
| Africans | 0.5 /100 | #256 | Tragic 83.4% |
| Jamaicans | 0.4 /100 | #257 | Tragic 83.3% |
| Malaysians | 0.4 /100 | #258 | Tragic 83.3% |
| Immigrants | Vietnam | 0.3 /100 | #259 | Tragic 83.2% |
| Choctaw | 0.3 /100 | #260 | Tragic 83.1% |
| Inupiat | 0.2 /100 | #261 | Tragic 83.1% |
| Immigrants | Armenia | 0.2 /100 | #262 | Tragic 83.1% |
| Immigrants | Congo | 0.2 /100 | #263 | Tragic 83.1% |
| Bangladeshis | 0.2 /100 | #264 | Tragic 83.1% |
Demographics Similar to Immigrants from Switzerland by GED/Equivalency
In terms of ged/equivalency, the demographic groups most similar to Immigrants from Switzerland are Immigrants from Latvia (88.1%, a difference of 0.010%), Czech (88.1%, a difference of 0.020%), Greek (88.1%, a difference of 0.020%), Australian (88.1%, a difference of 0.030%), and Immigrants from Korea (88.1%, a difference of 0.040%).
| Demographics | Rating | Rank | GED/Equivalency |
| Immigrants | Israel | 99.6 /100 | #39 | Exceptional 88.2% |
| Italians | 99.6 /100 | #40 | Exceptional 88.2% |
| Finns | 99.6 /100 | #41 | Exceptional 88.2% |
| Cambodians | 99.6 /100 | #42 | Exceptional 88.2% |
| Immigrants | Scotland | 99.6 /100 | #43 | Exceptional 88.2% |
| Macedonians | 99.5 /100 | #44 | Exceptional 88.1% |
| Czechs | 99.5 /100 | #45 | Exceptional 88.1% |
| Immigrants | Switzerland | 99.5 /100 | #46 | Exceptional 88.1% |
| Immigrants | Latvia | 99.5 /100 | #47 | Exceptional 88.1% |
| Greeks | 99.5 /100 | #48 | Exceptional 88.1% |
| Australians | 99.5 /100 | #49 | Exceptional 88.1% |
| Immigrants | Korea | 99.5 /100 | #50 | Exceptional 88.1% |
| Immigrants | Netherlands | 99.4 /100 | #51 | Exceptional 88.0% |
| Zimbabweans | 99.4 /100 | #52 | Exceptional 88.0% |
| Immigrants | South Africa | 99.4 /100 | #53 | Exceptional 88.0% |