Iranian vs Mongolian Bachelor's Degree
COMPARE
Iranian
Mongolian
Bachelor's Degree
Bachelor's Degree Comparison
Iranians
Mongolians
51.0%
BACHELOR'S DEGREE
100.0/ 100
METRIC RATING
5th/ 347
METRIC RANK
45.4%
BACHELOR'S DEGREE
100.0/ 100
METRIC RATING
36th/ 347
METRIC RANK
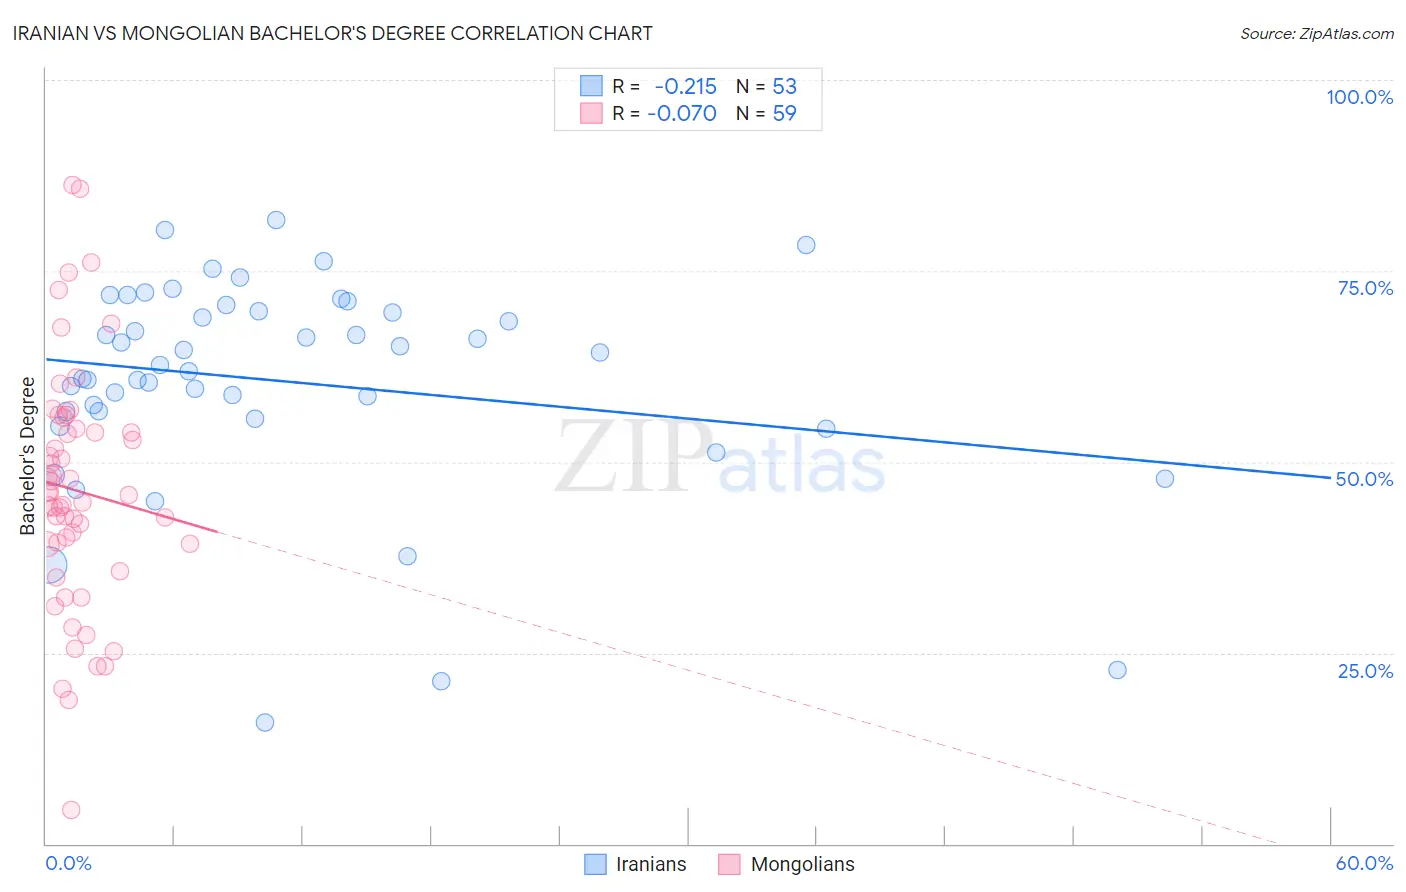
Iranian vs Mongolian Bachelor's Degree Correlation Chart
The statistical analysis conducted on geographies consisting of 316,876,001 people shows a weak negative correlation between the proportion of Iranians and percentage of population with at least bachelor's degree education in the United States with a correlation coefficient (R) of -0.215 and weighted average of 51.0%. Similarly, the statistical analysis conducted on geographies consisting of 140,357,131 people shows a slight negative correlation between the proportion of Mongolians and percentage of population with at least bachelor's degree education in the United States with a correlation coefficient (R) of -0.070 and weighted average of 45.4%, a difference of 12.2%.
Bachelor's Degree Correlation Summary
| Measurement | Iranian | Mongolian |
| Minimum | 15.8% | 4.5% |
| Maximum | 81.6% | 86.2% |
| Range | 65.8% | 81.7% |
| Mean | 60.5% | 46.3% |
| Median | 62.7% | 45.7% |
| Interquartile 25% (IQ1) | 56.1% | 39.2% |
| Interquartile 75% (IQ3) | 70.1% | 54.3% |
| Interquartile Range (IQR) | 14.0% | 15.0% |
| Standard Deviation (Sample) | 14.1% | 15.9% |
| Standard Deviation (Population) | 13.9% | 15.8% |
Similar Demographics by Bachelor's Degree
Demographics Similar to Iranians by Bachelor's Degree
In terms of bachelor's degree, the demographic groups most similar to Iranians are Immigrants from Taiwan (51.2%, a difference of 0.42%), Immigrants from India (51.3%, a difference of 0.63%), Okinawan (50.5%, a difference of 0.84%), Immigrants from Iran (50.3%, a difference of 1.3%), and Thai (50.1%, a difference of 1.7%).
| Demographics | Rating | Rank | Bachelor's Degree |
| Filipinos | 100.0 /100 | #1 | Exceptional 52.7% |
| Immigrants | Singapore | 100.0 /100 | #2 | Exceptional 51.9% |
| Immigrants | India | 100.0 /100 | #3 | Exceptional 51.3% |
| Immigrants | Taiwan | 100.0 /100 | #4 | Exceptional 51.2% |
| Iranians | 100.0 /100 | #5 | Exceptional 51.0% |
| Okinawans | 100.0 /100 | #6 | Exceptional 50.5% |
| Immigrants | Iran | 100.0 /100 | #7 | Exceptional 50.3% |
| Thais | 100.0 /100 | #8 | Exceptional 50.1% |
| Immigrants | Israel | 100.0 /100 | #9 | Exceptional 50.0% |
| Cypriots | 100.0 /100 | #10 | Exceptional 49.0% |
| Immigrants | Australia | 100.0 /100 | #11 | Exceptional 48.5% |
| Immigrants | China | 100.0 /100 | #12 | Exceptional 48.4% |
| Immigrants | South Central Asia | 100.0 /100 | #13 | Exceptional 48.3% |
| Immigrants | Hong Kong | 100.0 /100 | #14 | Exceptional 48.2% |
| Immigrants | Eastern Asia | 100.0 /100 | #15 | Exceptional 48.1% |
Demographics Similar to Mongolians by Bachelor's Degree
In terms of bachelor's degree, the demographic groups most similar to Mongolians are Immigrants from Russia (45.4%, a difference of 0.020%), Immigrants from Denmark (45.4%, a difference of 0.040%), Russian (45.3%, a difference of 0.15%), Bulgarian (45.3%, a difference of 0.24%), and Immigrants from Northern Europe (45.6%, a difference of 0.50%).
| Demographics | Rating | Rank | Bachelor's Degree |
| Israelis | 100.0 /100 | #29 | Exceptional 46.1% |
| Immigrants | Sri Lanka | 100.0 /100 | #30 | Exceptional 46.1% |
| Latvians | 100.0 /100 | #31 | Exceptional 46.1% |
| Immigrants | Turkey | 100.0 /100 | #32 | Exceptional 46.0% |
| Immigrants | Northern Europe | 100.0 /100 | #33 | Exceptional 45.6% |
| Immigrants | Denmark | 100.0 /100 | #34 | Exceptional 45.4% |
| Immigrants | Russia | 100.0 /100 | #35 | Exceptional 45.4% |
| Mongolians | 100.0 /100 | #36 | Exceptional 45.4% |
| Russians | 100.0 /100 | #37 | Exceptional 45.3% |
| Bulgarians | 100.0 /100 | #38 | Exceptional 45.3% |
| Immigrants | Latvia | 100.0 /100 | #39 | Exceptional 45.1% |
| Immigrants | Belarus | 100.0 /100 | #40 | Exceptional 45.0% |
| Immigrants | Malaysia | 100.0 /100 | #41 | Exceptional 45.0% |
| Immigrants | Saudi Arabia | 100.0 /100 | #42 | Exceptional 44.8% |
| Immigrants | South Africa | 99.9 /100 | #43 | Exceptional 44.8% |