Immigrants from Belgium vs Mongolian Bachelor's Degree
COMPARE
Immigrants from Belgium
Mongolian
Bachelor's Degree
Bachelor's Degree Comparison
Immigrants from Belgium
Mongolians
47.0%
BACHELOR'S DEGREE
100.0/ 100
METRIC RATING
22nd/ 347
METRIC RANK
45.4%
BACHELOR'S DEGREE
100.0/ 100
METRIC RATING
36th/ 347
METRIC RANK
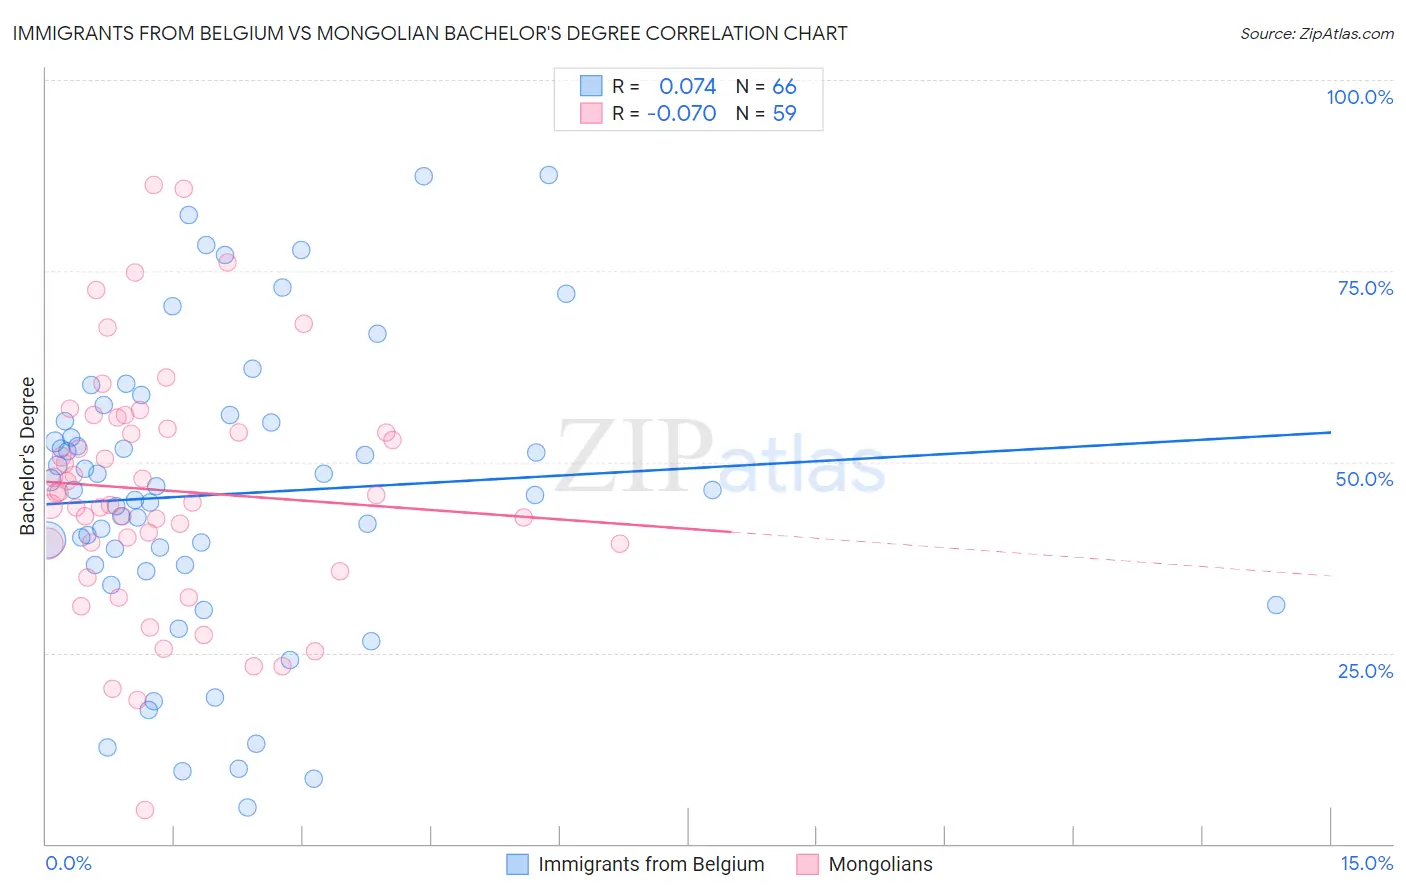
Immigrants from Belgium vs Mongolian Bachelor's Degree Correlation Chart
The statistical analysis conducted on geographies consisting of 146,728,237 people shows a slight positive correlation between the proportion of Immigrants from Belgium and percentage of population with at least bachelor's degree education in the United States with a correlation coefficient (R) of 0.074 and weighted average of 47.0%. Similarly, the statistical analysis conducted on geographies consisting of 140,357,131 people shows a slight negative correlation between the proportion of Mongolians and percentage of population with at least bachelor's degree education in the United States with a correlation coefficient (R) of -0.070 and weighted average of 45.4%, a difference of 3.6%.
Bachelor's Degree Correlation Summary
| Measurement | Immigrants from Belgium | Mongolian |
| Minimum | 4.8% | 4.5% |
| Maximum | 87.6% | 86.2% |
| Range | 82.8% | 81.7% |
| Mean | 45.7% | 46.3% |
| Median | 46.3% | 45.7% |
| Interquartile 25% (IQ1) | 36.5% | 39.2% |
| Interquartile 75% (IQ3) | 55.4% | 54.3% |
| Interquartile Range (IQR) | 18.9% | 15.0% |
| Standard Deviation (Sample) | 19.4% | 15.9% |
| Standard Deviation (Population) | 19.2% | 15.8% |
Demographics Similar to Immigrants from Belgium and Mongolians by Bachelor's Degree
In terms of bachelor's degree, the demographic groups most similar to Immigrants from Belgium are Immigrants from Sweden (47.0%, a difference of 0.090%), Immigrants from Korea (47.0%, a difference of 0.13%), Immigrants from Ireland (47.1%, a difference of 0.20%), Immigrants from Switzerland (47.1%, a difference of 0.21%), and Burmese (46.9%, a difference of 0.35%). Similarly, the demographic groups most similar to Mongolians are Immigrants from Russia (45.4%, a difference of 0.020%), Immigrants from Denmark (45.4%, a difference of 0.040%), Russian (45.3%, a difference of 0.15%), Bulgarian (45.3%, a difference of 0.24%), and Immigrants from Northern Europe (45.6%, a difference of 0.50%).
| Demographics | Rating | Rank | Bachelor's Degree |
| Cambodians | 100.0 /100 | #19 | Exceptional 47.2% |
| Immigrants | Switzerland | 100.0 /100 | #20 | Exceptional 47.1% |
| Immigrants | Ireland | 100.0 /100 | #21 | Exceptional 47.1% |
| Immigrants | Belgium | 100.0 /100 | #22 | Exceptional 47.0% |
| Immigrants | Sweden | 100.0 /100 | #23 | Exceptional 47.0% |
| Immigrants | Korea | 100.0 /100 | #24 | Exceptional 47.0% |
| Burmese | 100.0 /100 | #25 | Exceptional 46.9% |
| Immigrants | Japan | 100.0 /100 | #26 | Exceptional 46.8% |
| Immigrants | France | 100.0 /100 | #27 | Exceptional 46.4% |
| Turks | 100.0 /100 | #28 | Exceptional 46.2% |
| Israelis | 100.0 /100 | #29 | Exceptional 46.1% |
| Immigrants | Sri Lanka | 100.0 /100 | #30 | Exceptional 46.1% |
| Latvians | 100.0 /100 | #31 | Exceptional 46.1% |
| Immigrants | Turkey | 100.0 /100 | #32 | Exceptional 46.0% |
| Immigrants | Northern Europe | 100.0 /100 | #33 | Exceptional 45.6% |
| Immigrants | Denmark | 100.0 /100 | #34 | Exceptional 45.4% |
| Immigrants | Russia | 100.0 /100 | #35 | Exceptional 45.4% |
| Mongolians | 100.0 /100 | #36 | Exceptional 45.4% |
| Russians | 100.0 /100 | #37 | Exceptional 45.3% |
| Bulgarians | 100.0 /100 | #38 | Exceptional 45.3% |
| Immigrants | Latvia | 100.0 /100 | #39 | Exceptional 45.1% |