Iranian vs Native Hawaiian Bachelor's Degree
COMPARE
Iranian
Native Hawaiian
Bachelor's Degree
Bachelor's Degree Comparison
Iranians
Native Hawaiians
51.0%
BACHELOR'S DEGREE
100.0/ 100
METRIC RATING
5th/ 347
METRIC RANK
33.2%
BACHELOR'S DEGREE
0.7/ 100
METRIC RATING
254th/ 347
METRIC RANK
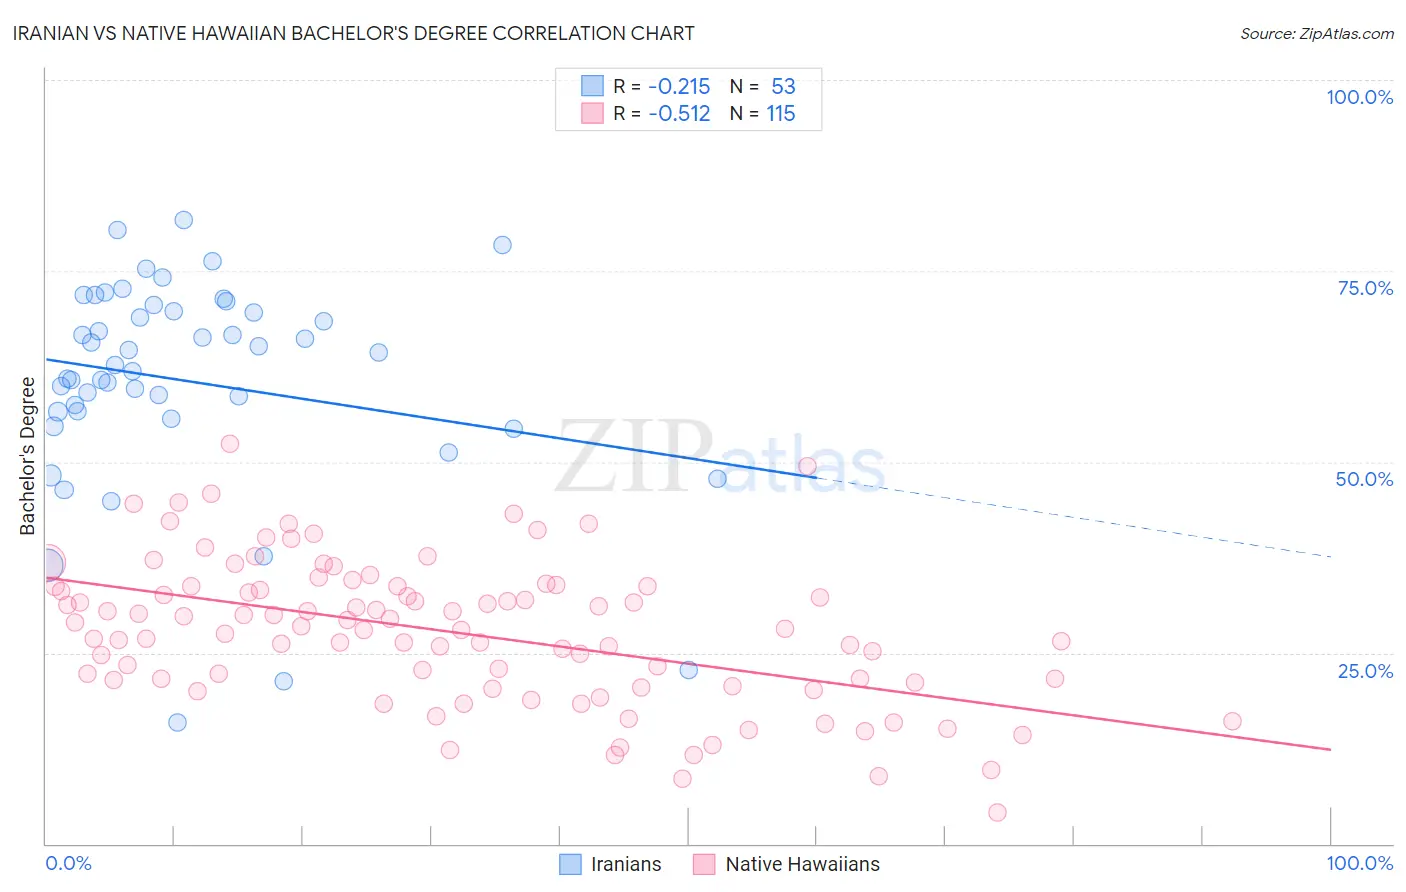
Iranian vs Native Hawaiian Bachelor's Degree Correlation Chart
The statistical analysis conducted on geographies consisting of 316,876,001 people shows a weak negative correlation between the proportion of Iranians and percentage of population with at least bachelor's degree education in the United States with a correlation coefficient (R) of -0.215 and weighted average of 51.0%. Similarly, the statistical analysis conducted on geographies consisting of 332,091,621 people shows a substantial negative correlation between the proportion of Native Hawaiians and percentage of population with at least bachelor's degree education in the United States with a correlation coefficient (R) of -0.512 and weighted average of 33.2%, a difference of 53.4%.
Bachelor's Degree Correlation Summary
| Measurement | Iranian | Native Hawaiian |
| Minimum | 15.8% | 4.0% |
| Maximum | 81.6% | 52.3% |
| Range | 65.8% | 48.3% |
| Mean | 60.5% | 27.7% |
| Median | 62.7% | 28.2% |
| Interquartile 25% (IQ1) | 56.1% | 21.1% |
| Interquartile 75% (IQ3) | 70.1% | 33.6% |
| Interquartile Range (IQR) | 14.0% | 12.5% |
| Standard Deviation (Sample) | 14.1% | 9.4% |
| Standard Deviation (Population) | 13.9% | 9.4% |
Similar Demographics by Bachelor's Degree
Demographics Similar to Iranians by Bachelor's Degree
In terms of bachelor's degree, the demographic groups most similar to Iranians are Immigrants from Taiwan (51.2%, a difference of 0.42%), Immigrants from India (51.3%, a difference of 0.63%), Okinawan (50.5%, a difference of 0.84%), Immigrants from Iran (50.3%, a difference of 1.3%), and Thai (50.1%, a difference of 1.7%).
| Demographics | Rating | Rank | Bachelor's Degree |
| Filipinos | 100.0 /100 | #1 | Exceptional 52.7% |
| Immigrants | Singapore | 100.0 /100 | #2 | Exceptional 51.9% |
| Immigrants | India | 100.0 /100 | #3 | Exceptional 51.3% |
| Immigrants | Taiwan | 100.0 /100 | #4 | Exceptional 51.2% |
| Iranians | 100.0 /100 | #5 | Exceptional 51.0% |
| Okinawans | 100.0 /100 | #6 | Exceptional 50.5% |
| Immigrants | Iran | 100.0 /100 | #7 | Exceptional 50.3% |
| Thais | 100.0 /100 | #8 | Exceptional 50.1% |
| Immigrants | Israel | 100.0 /100 | #9 | Exceptional 50.0% |
| Cypriots | 100.0 /100 | #10 | Exceptional 49.0% |
| Immigrants | Australia | 100.0 /100 | #11 | Exceptional 48.5% |
| Immigrants | China | 100.0 /100 | #12 | Exceptional 48.4% |
| Immigrants | South Central Asia | 100.0 /100 | #13 | Exceptional 48.3% |
| Immigrants | Hong Kong | 100.0 /100 | #14 | Exceptional 48.2% |
| Immigrants | Eastern Asia | 100.0 /100 | #15 | Exceptional 48.1% |
Demographics Similar to Native Hawaiians by Bachelor's Degree
In terms of bachelor's degree, the demographic groups most similar to Native Hawaiians are Iroquois (33.2%, a difference of 0.020%), U.S. Virgin Islander (33.2%, a difference of 0.060%), Nicaraguan (33.1%, a difference of 0.20%), Immigrants from Bahamas (33.3%, a difference of 0.27%), and Japanese (33.3%, a difference of 0.34%).
| Demographics | Rating | Rank | Bachelor's Degree |
| Immigrants | Congo | 1.0 /100 | #247 | Tragic 33.6% |
| Cree | 1.0 /100 | #248 | Tragic 33.6% |
| Immigrants | Liberia | 0.9 /100 | #249 | Tragic 33.5% |
| Indonesians | 0.9 /100 | #250 | Tragic 33.5% |
| Japanese | 0.7 /100 | #251 | Tragic 33.3% |
| Immigrants | Bahamas | 0.7 /100 | #252 | Tragic 33.3% |
| U.S. Virgin Islanders | 0.7 /100 | #253 | Tragic 33.2% |
| Native Hawaiians | 0.7 /100 | #254 | Tragic 33.2% |
| Iroquois | 0.7 /100 | #255 | Tragic 33.2% |
| Nicaraguans | 0.6 /100 | #256 | Tragic 33.1% |
| Spanish Americans | 0.6 /100 | #257 | Tragic 33.1% |
| French American Indians | 0.6 /100 | #258 | Tragic 33.1% |
| Osage | 0.5 /100 | #259 | Tragic 33.0% |
| Malaysians | 0.5 /100 | #260 | Tragic 32.9% |
| Africans | 0.5 /100 | #261 | Tragic 32.9% |