Iranian vs Alsatian Bachelor's Degree
COMPARE
Iranian
Alsatian
Bachelor's Degree
Bachelor's Degree Comparison
Iranians
Alsatians
51.0%
BACHELOR'S DEGREE
100.0/ 100
METRIC RATING
5th/ 347
METRIC RANK
41.0%
BACHELOR'S DEGREE
97.0/ 100
METRIC RATING
106th/ 347
METRIC RANK
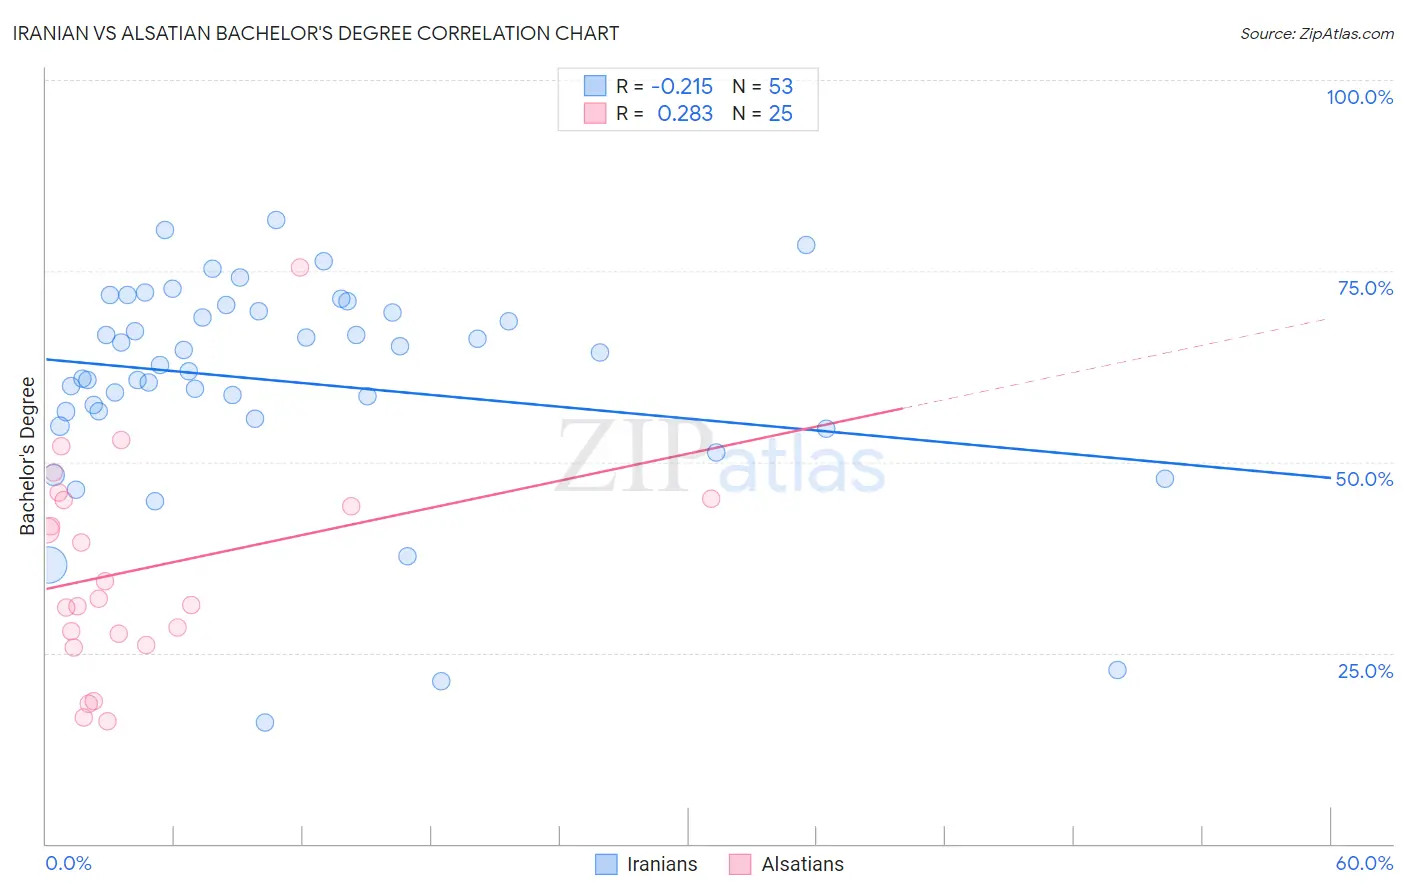
Iranian vs Alsatian Bachelor's Degree Correlation Chart
The statistical analysis conducted on geographies consisting of 316,876,001 people shows a weak negative correlation between the proportion of Iranians and percentage of population with at least bachelor's degree education in the United States with a correlation coefficient (R) of -0.215 and weighted average of 51.0%. Similarly, the statistical analysis conducted on geographies consisting of 82,682,365 people shows a weak positive correlation between the proportion of Alsatians and percentage of population with at least bachelor's degree education in the United States with a correlation coefficient (R) of 0.283 and weighted average of 41.0%, a difference of 24.2%.
Bachelor's Degree Correlation Summary
| Measurement | Iranian | Alsatian |
| Minimum | 15.8% | 16.0% |
| Maximum | 81.6% | 75.4% |
| Range | 65.8% | 59.4% |
| Mean | 60.5% | 35.8% |
| Median | 62.7% | 32.1% |
| Interquartile 25% (IQ1) | 56.1% | 26.7% |
| Interquartile 75% (IQ3) | 70.1% | 45.1% |
| Interquartile Range (IQR) | 14.0% | 18.4% |
| Standard Deviation (Sample) | 14.1% | 13.8% |
| Standard Deviation (Population) | 13.9% | 13.5% |
Similar Demographics by Bachelor's Degree
Demographics Similar to Iranians by Bachelor's Degree
In terms of bachelor's degree, the demographic groups most similar to Iranians are Immigrants from Taiwan (51.2%, a difference of 0.42%), Immigrants from India (51.3%, a difference of 0.63%), Okinawan (50.5%, a difference of 0.84%), Immigrants from Iran (50.3%, a difference of 1.3%), and Thai (50.1%, a difference of 1.7%).
| Demographics | Rating | Rank | Bachelor's Degree |
| Filipinos | 100.0 /100 | #1 | Exceptional 52.7% |
| Immigrants | Singapore | 100.0 /100 | #2 | Exceptional 51.9% |
| Immigrants | India | 100.0 /100 | #3 | Exceptional 51.3% |
| Immigrants | Taiwan | 100.0 /100 | #4 | Exceptional 51.2% |
| Iranians | 100.0 /100 | #5 | Exceptional 51.0% |
| Okinawans | 100.0 /100 | #6 | Exceptional 50.5% |
| Immigrants | Iran | 100.0 /100 | #7 | Exceptional 50.3% |
| Thais | 100.0 /100 | #8 | Exceptional 50.1% |
| Immigrants | Israel | 100.0 /100 | #9 | Exceptional 50.0% |
| Cypriots | 100.0 /100 | #10 | Exceptional 49.0% |
| Immigrants | Australia | 100.0 /100 | #11 | Exceptional 48.5% |
| Immigrants | China | 100.0 /100 | #12 | Exceptional 48.4% |
| Immigrants | South Central Asia | 100.0 /100 | #13 | Exceptional 48.3% |
| Immigrants | Hong Kong | 100.0 /100 | #14 | Exceptional 48.2% |
| Immigrants | Eastern Asia | 100.0 /100 | #15 | Exceptional 48.1% |
Demographics Similar to Alsatians by Bachelor's Degree
In terms of bachelor's degree, the demographic groups most similar to Alsatians are Northern European (41.0%, a difference of 0.17%), Syrian (41.1%, a difference of 0.26%), Jordanian (41.2%, a difference of 0.29%), Ukrainian (40.9%, a difference of 0.31%), and Arab (40.9%, a difference of 0.33%).
| Demographics | Rating | Rank | Bachelor's Degree |
| Immigrants | England | 98.1 /100 | #99 | Exceptional 41.4% |
| Macedonians | 98.1 /100 | #100 | Exceptional 41.4% |
| Immigrants | Morocco | 98.0 /100 | #101 | Exceptional 41.4% |
| Immigrants | Italy | 97.8 /100 | #102 | Exceptional 41.3% |
| Chileans | 97.5 /100 | #103 | Exceptional 41.2% |
| Jordanians | 97.4 /100 | #104 | Exceptional 41.2% |
| Syrians | 97.4 /100 | #105 | Exceptional 41.1% |
| Alsatians | 97.0 /100 | #106 | Exceptional 41.0% |
| Northern Europeans | 96.8 /100 | #107 | Exceptional 41.0% |
| Ukrainians | 96.6 /100 | #108 | Exceptional 40.9% |
| Arabs | 96.6 /100 | #109 | Exceptional 40.9% |
| Albanians | 96.5 /100 | #110 | Exceptional 40.9% |
| Immigrants | Chile | 96.4 /100 | #111 | Exceptional 40.8% |
| Ugandans | 96.3 /100 | #112 | Exceptional 40.8% |
| Brazilians | 96.3 /100 | #113 | Exceptional 40.8% |