Iranian vs Mongolian Family Poverty
COMPARE
Iranian
Mongolian
Family Poverty
Family Poverty Comparison
Iranians
Mongolians
7.1%
FAMILY POVERTY
99.8/ 100
METRIC RATING
14th/ 347
METRIC RANK
8.6%
FAMILY POVERTY
80.4/ 100
METRIC RATING
149th/ 347
METRIC RANK
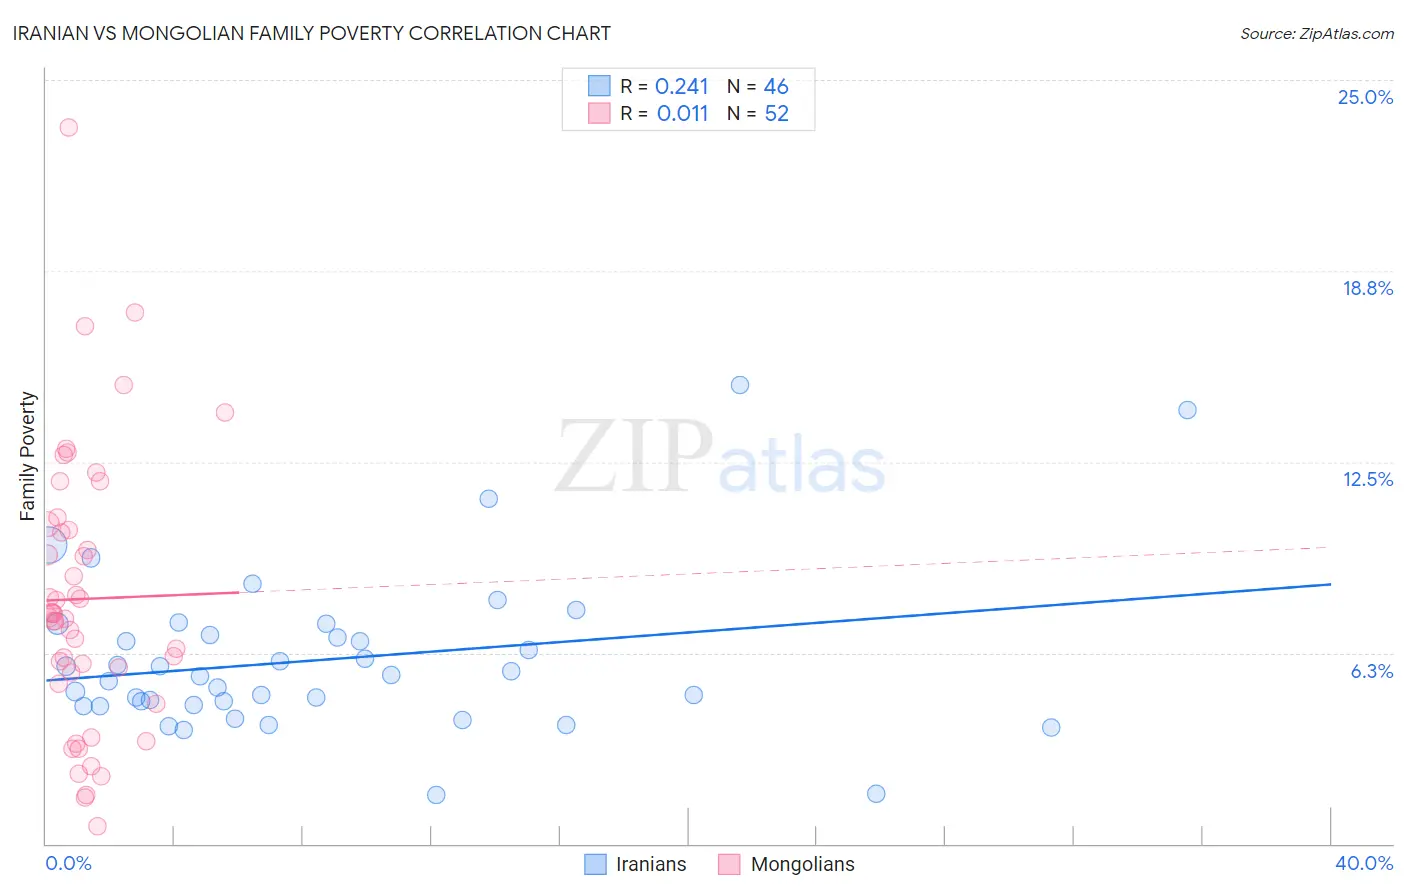
Iranian vs Mongolian Family Poverty Correlation Chart
The statistical analysis conducted on geographies consisting of 316,120,313 people shows a weak positive correlation between the proportion of Iranians and poverty level among families in the United States with a correlation coefficient (R) of 0.241 and weighted average of 7.1%. Similarly, the statistical analysis conducted on geographies consisting of 140,209,736 people shows no correlation between the proportion of Mongolians and poverty level among families in the United States with a correlation coefficient (R) of 0.011 and weighted average of 8.6%, a difference of 20.6%.
Family Poverty Correlation Summary
| Measurement | Iranian | Mongolian |
| Minimum | 1.6% | 0.58% |
| Maximum | 15.0% | 23.4% |
| Range | 13.4% | 22.8% |
| Mean | 6.0% | 8.0% |
| Median | 5.5% | 7.5% |
| Interquartile 25% (IQ1) | 4.5% | 5.4% |
| Interquartile 75% (IQ3) | 6.8% | 10.4% |
| Interquartile Range (IQR) | 2.3% | 4.9% |
| Standard Deviation (Sample) | 2.6% | 4.5% |
| Standard Deviation (Population) | 2.6% | 4.5% |
Similar Demographics by Family Poverty
Demographics Similar to Iranians by Family Poverty
In terms of family poverty, the demographic groups most similar to Iranians are Swedish (7.1%, a difference of 0.010%), Maltese (7.1%, a difference of 0.060%), Immigrants from Singapore (7.1%, a difference of 0.34%), Bulgarian (7.1%, a difference of 0.36%), and Latvian (7.1%, a difference of 0.61%).
| Demographics | Rating | Rank | Family Poverty |
| Immigrants | Ireland | 99.9 /100 | #7 | Exceptional 7.0% |
| Bhutanese | 99.9 /100 | #8 | Exceptional 7.0% |
| Latvians | 99.9 /100 | #9 | Exceptional 7.1% |
| Bulgarians | 99.8 /100 | #10 | Exceptional 7.1% |
| Immigrants | Singapore | 99.8 /100 | #11 | Exceptional 7.1% |
| Maltese | 99.8 /100 | #12 | Exceptional 7.1% |
| Swedes | 99.8 /100 | #13 | Exceptional 7.1% |
| Iranians | 99.8 /100 | #14 | Exceptional 7.1% |
| Lithuanians | 99.8 /100 | #15 | Exceptional 7.2% |
| Immigrants | South Central Asia | 99.8 /100 | #16 | Exceptional 7.2% |
| Luxembourgers | 99.8 /100 | #17 | Exceptional 7.2% |
| Immigrants | Lithuania | 99.8 /100 | #18 | Exceptional 7.2% |
| Eastern Europeans | 99.7 /100 | #19 | Exceptional 7.2% |
| Immigrants | Hong Kong | 99.7 /100 | #20 | Exceptional 7.3% |
| Immigrants | Iran | 99.7 /100 | #21 | Exceptional 7.3% |
Demographics Similar to Mongolians by Family Poverty
In terms of family poverty, the demographic groups most similar to Mongolians are Syrian (8.6%, a difference of 0.0%), Brazilian (8.6%, a difference of 0.050%), Samoan (8.6%, a difference of 0.13%), Immigrants from Spain (8.6%, a difference of 0.26%), and Scotch-Irish (8.6%, a difference of 0.41%).
| Demographics | Rating | Rank | Family Poverty |
| Yugoslavians | 83.5 /100 | #142 | Excellent 8.5% |
| Immigrants | Germany | 83.3 /100 | #143 | Excellent 8.5% |
| Albanians | 83.3 /100 | #144 | Excellent 8.5% |
| Immigrants | South Eastern Asia | 83.2 /100 | #145 | Excellent 8.5% |
| Immigrants | Belarus | 83.2 /100 | #146 | Excellent 8.5% |
| Immigrants | Jordan | 83.0 /100 | #147 | Excellent 8.5% |
| Scotch-Irish | 82.2 /100 | #148 | Excellent 8.6% |
| Mongolians | 80.4 /100 | #149 | Excellent 8.6% |
| Syrians | 80.3 /100 | #150 | Excellent 8.6% |
| Brazilians | 80.1 /100 | #151 | Excellent 8.6% |
| Samoans | 79.8 /100 | #152 | Good 8.6% |
| Immigrants | Spain | 79.1 /100 | #153 | Good 8.6% |
| Immigrants | Vietnam | 75.4 /100 | #154 | Good 8.7% |
| Immigrants | Kuwait | 73.6 /100 | #155 | Good 8.7% |
| Immigrants | Oceania | 71.2 /100 | #156 | Good 8.7% |