Afghan vs Mongolian Bachelor's Degree
COMPARE
Afghan
Mongolian
Bachelor's Degree
Bachelor's Degree Comparison
Afghans
Mongolians
40.8%
BACHELOR'S DEGREE
96.2/ 100
METRIC RATING
114th/ 347
METRIC RANK
45.4%
BACHELOR'S DEGREE
100.0/ 100
METRIC RATING
36th/ 347
METRIC RANK
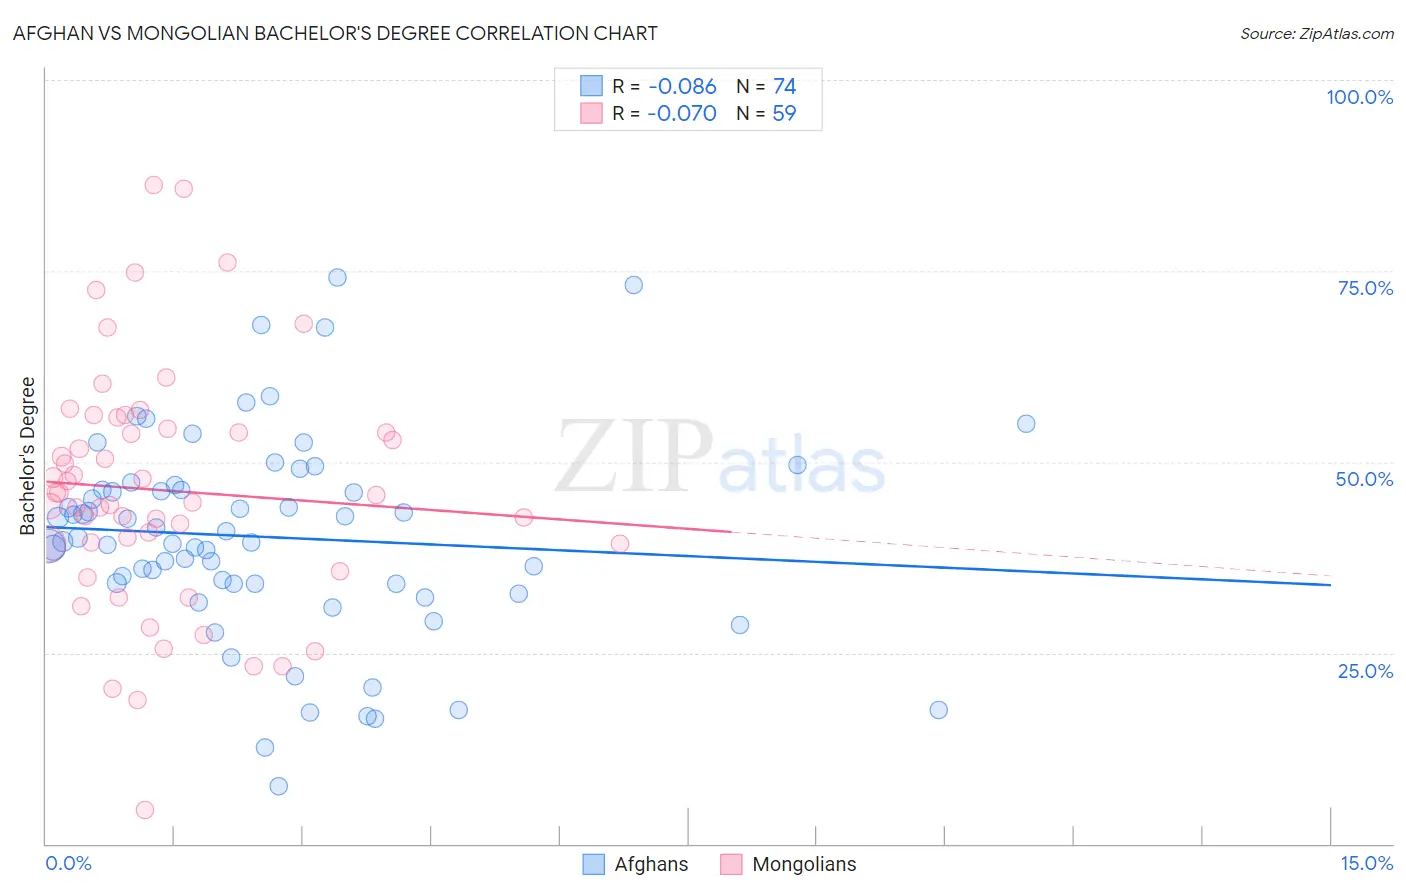
Afghan vs Mongolian Bachelor's Degree Correlation Chart
The statistical analysis conducted on geographies consisting of 148,869,794 people shows a slight negative correlation between the proportion of Afghans and percentage of population with at least bachelor's degree education in the United States with a correlation coefficient (R) of -0.086 and weighted average of 40.8%. Similarly, the statistical analysis conducted on geographies consisting of 140,357,131 people shows a slight negative correlation between the proportion of Mongolians and percentage of population with at least bachelor's degree education in the United States with a correlation coefficient (R) of -0.070 and weighted average of 45.4%, a difference of 11.3%.
Bachelor's Degree Correlation Summary
| Measurement | Afghan | Mongolian |
| Minimum | 7.6% | 4.5% |
| Maximum | 74.2% | 86.2% |
| Range | 66.6% | 81.7% |
| Mean | 40.2% | 46.3% |
| Median | 39.8% | 45.7% |
| Interquartile 25% (IQ1) | 34.1% | 39.2% |
| Interquartile 75% (IQ3) | 46.4% | 54.3% |
| Interquartile Range (IQR) | 12.3% | 15.0% |
| Standard Deviation (Sample) | 13.3% | 15.9% |
| Standard Deviation (Population) | 13.2% | 15.8% |
Similar Demographics by Bachelor's Degree
Demographics Similar to Afghans by Bachelor's Degree
In terms of bachelor's degree, the demographic groups most similar to Afghans are Brazilian (40.8%, a difference of 0.030%), Ugandan (40.8%, a difference of 0.070%), Immigrants from Chile (40.8%, a difference of 0.12%), Albanian (40.9%, a difference of 0.16%), and Arab (40.9%, a difference of 0.24%).
| Demographics | Rating | Rank | Bachelor's Degree |
| Northern Europeans | 96.8 /100 | #107 | Exceptional 41.0% |
| Ukrainians | 96.6 /100 | #108 | Exceptional 40.9% |
| Arabs | 96.6 /100 | #109 | Exceptional 40.9% |
| Albanians | 96.5 /100 | #110 | Exceptional 40.9% |
| Immigrants | Chile | 96.4 /100 | #111 | Exceptional 40.8% |
| Ugandans | 96.3 /100 | #112 | Exceptional 40.8% |
| Brazilians | 96.3 /100 | #113 | Exceptional 40.8% |
| Afghans | 96.2 /100 | #114 | Exceptional 40.8% |
| Palestinians | 95.8 /100 | #115 | Exceptional 40.7% |
| Immigrants | Uganda | 95.7 /100 | #116 | Exceptional 40.7% |
| Austrians | 95.5 /100 | #117 | Exceptional 40.6% |
| Croatians | 95.5 /100 | #118 | Exceptional 40.6% |
| Immigrants | Syria | 94.9 /100 | #119 | Exceptional 40.5% |
| Venezuelans | 94.7 /100 | #120 | Exceptional 40.5% |
| Moroccans | 94.6 /100 | #121 | Exceptional 40.5% |
Demographics Similar to Mongolians by Bachelor's Degree
In terms of bachelor's degree, the demographic groups most similar to Mongolians are Immigrants from Russia (45.4%, a difference of 0.020%), Immigrants from Denmark (45.4%, a difference of 0.040%), Russian (45.3%, a difference of 0.15%), Bulgarian (45.3%, a difference of 0.24%), and Immigrants from Northern Europe (45.6%, a difference of 0.50%).
| Demographics | Rating | Rank | Bachelor's Degree |
| Israelis | 100.0 /100 | #29 | Exceptional 46.1% |
| Immigrants | Sri Lanka | 100.0 /100 | #30 | Exceptional 46.1% |
| Latvians | 100.0 /100 | #31 | Exceptional 46.1% |
| Immigrants | Turkey | 100.0 /100 | #32 | Exceptional 46.0% |
| Immigrants | Northern Europe | 100.0 /100 | #33 | Exceptional 45.6% |
| Immigrants | Denmark | 100.0 /100 | #34 | Exceptional 45.4% |
| Immigrants | Russia | 100.0 /100 | #35 | Exceptional 45.4% |
| Mongolians | 100.0 /100 | #36 | Exceptional 45.4% |
| Russians | 100.0 /100 | #37 | Exceptional 45.3% |
| Bulgarians | 100.0 /100 | #38 | Exceptional 45.3% |
| Immigrants | Latvia | 100.0 /100 | #39 | Exceptional 45.1% |
| Immigrants | Belarus | 100.0 /100 | #40 | Exceptional 45.0% |
| Immigrants | Malaysia | 100.0 /100 | #41 | Exceptional 45.0% |
| Immigrants | Saudi Arabia | 100.0 /100 | #42 | Exceptional 44.8% |
| Immigrants | South Africa | 99.9 /100 | #43 | Exceptional 44.8% |