Iranian vs Immigrants from Eritrea Bachelor's Degree
COMPARE
Iranian
Immigrants from Eritrea
Bachelor's Degree
Bachelor's Degree Comparison
Iranians
Immigrants from Eritrea
51.0%
BACHELOR'S DEGREE
100.0/ 100
METRIC RATING
5th/ 347
METRIC RANK
40.4%
BACHELOR'S DEGREE
94.3/ 100
METRIC RATING
124th/ 347
METRIC RANK
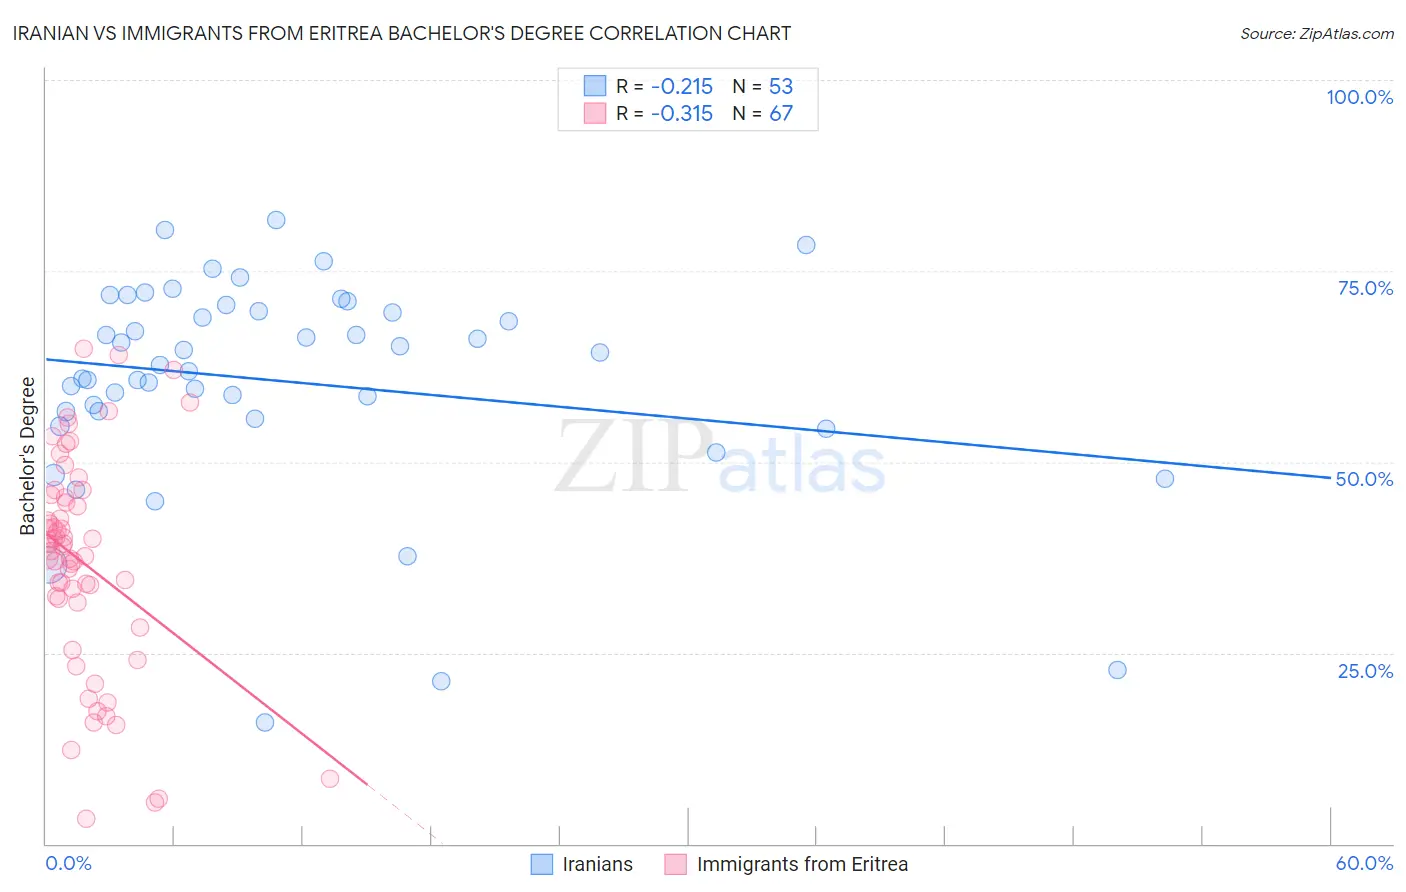
Iranian vs Immigrants from Eritrea Bachelor's Degree Correlation Chart
The statistical analysis conducted on geographies consisting of 316,876,001 people shows a weak negative correlation between the proportion of Iranians and percentage of population with at least bachelor's degree education in the United States with a correlation coefficient (R) of -0.215 and weighted average of 51.0%. Similarly, the statistical analysis conducted on geographies consisting of 104,855,166 people shows a mild negative correlation between the proportion of Immigrants from Eritrea and percentage of population with at least bachelor's degree education in the United States with a correlation coefficient (R) of -0.315 and weighted average of 40.4%, a difference of 26.1%.
Bachelor's Degree Correlation Summary
| Measurement | Iranian | Immigrants from Eritrea |
| Minimum | 15.8% | 3.2% |
| Maximum | 81.6% | 64.8% |
| Range | 65.8% | 61.6% |
| Mean | 60.5% | 36.7% |
| Median | 62.7% | 39.0% |
| Interquartile 25% (IQ1) | 56.1% | 31.5% |
| Interquartile 75% (IQ3) | 70.1% | 45.4% |
| Interquartile Range (IQR) | 14.0% | 13.9% |
| Standard Deviation (Sample) | 14.1% | 14.2% |
| Standard Deviation (Population) | 13.9% | 14.1% |
Similar Demographics by Bachelor's Degree
Demographics Similar to Iranians by Bachelor's Degree
In terms of bachelor's degree, the demographic groups most similar to Iranians are Immigrants from Taiwan (51.2%, a difference of 0.42%), Immigrants from India (51.3%, a difference of 0.63%), Okinawan (50.5%, a difference of 0.84%), Immigrants from Iran (50.3%, a difference of 1.3%), and Thai (50.1%, a difference of 1.7%).
| Demographics | Rating | Rank | Bachelor's Degree |
| Filipinos | 100.0 /100 | #1 | Exceptional 52.7% |
| Immigrants | Singapore | 100.0 /100 | #2 | Exceptional 51.9% |
| Immigrants | India | 100.0 /100 | #3 | Exceptional 51.3% |
| Immigrants | Taiwan | 100.0 /100 | #4 | Exceptional 51.2% |
| Iranians | 100.0 /100 | #5 | Exceptional 51.0% |
| Okinawans | 100.0 /100 | #6 | Exceptional 50.5% |
| Immigrants | Iran | 100.0 /100 | #7 | Exceptional 50.3% |
| Thais | 100.0 /100 | #8 | Exceptional 50.1% |
| Immigrants | Israel | 100.0 /100 | #9 | Exceptional 50.0% |
| Cypriots | 100.0 /100 | #10 | Exceptional 49.0% |
| Immigrants | Australia | 100.0 /100 | #11 | Exceptional 48.5% |
| Immigrants | China | 100.0 /100 | #12 | Exceptional 48.4% |
| Immigrants | South Central Asia | 100.0 /100 | #13 | Exceptional 48.3% |
| Immigrants | Hong Kong | 100.0 /100 | #14 | Exceptional 48.2% |
| Immigrants | Eastern Asia | 100.0 /100 | #15 | Exceptional 48.1% |
Demographics Similar to Immigrants from Eritrea by Bachelor's Degree
In terms of bachelor's degree, the demographic groups most similar to Immigrants from Eritrea are Lebanese (40.4%, a difference of 0.0%), Immigrants from Albania (40.4%, a difference of 0.020%), British (40.4%, a difference of 0.030%), Immigrants from Eastern Africa (40.4%, a difference of 0.080%), and Moroccan (40.5%, a difference of 0.12%).
| Demographics | Rating | Rank | Bachelor's Degree |
| Austrians | 95.5 /100 | #117 | Exceptional 40.6% |
| Croatians | 95.5 /100 | #118 | Exceptional 40.6% |
| Immigrants | Syria | 94.9 /100 | #119 | Exceptional 40.5% |
| Venezuelans | 94.7 /100 | #120 | Exceptional 40.5% |
| Moroccans | 94.6 /100 | #121 | Exceptional 40.5% |
| Immigrants | Albania | 94.4 /100 | #122 | Exceptional 40.4% |
| Lebanese | 94.3 /100 | #123 | Exceptional 40.4% |
| Immigrants | Eritrea | 94.3 /100 | #124 | Exceptional 40.4% |
| British | 94.2 /100 | #125 | Exceptional 40.4% |
| Immigrants | Eastern Africa | 94.1 /100 | #126 | Exceptional 40.4% |
| Immigrants | Jordan | 93.4 /100 | #127 | Exceptional 40.3% |
| Immigrants | Venezuela | 92.9 /100 | #128 | Exceptional 40.2% |
| Serbians | 92.4 /100 | #129 | Exceptional 40.1% |
| Sierra Leoneans | 92.2 /100 | #130 | Exceptional 40.1% |
| Italians | 91.9 /100 | #131 | Exceptional 40.1% |