Immigrants from Panama vs Mongolian Bachelor's Degree
COMPARE
Immigrants from Panama
Mongolian
Bachelor's Degree
Bachelor's Degree Comparison
Immigrants from Panama
Mongolians
36.2%
BACHELOR'S DEGREE
14.2/ 100
METRIC RATING
213th/ 347
METRIC RANK
45.4%
BACHELOR'S DEGREE
100.0/ 100
METRIC RATING
36th/ 347
METRIC RANK
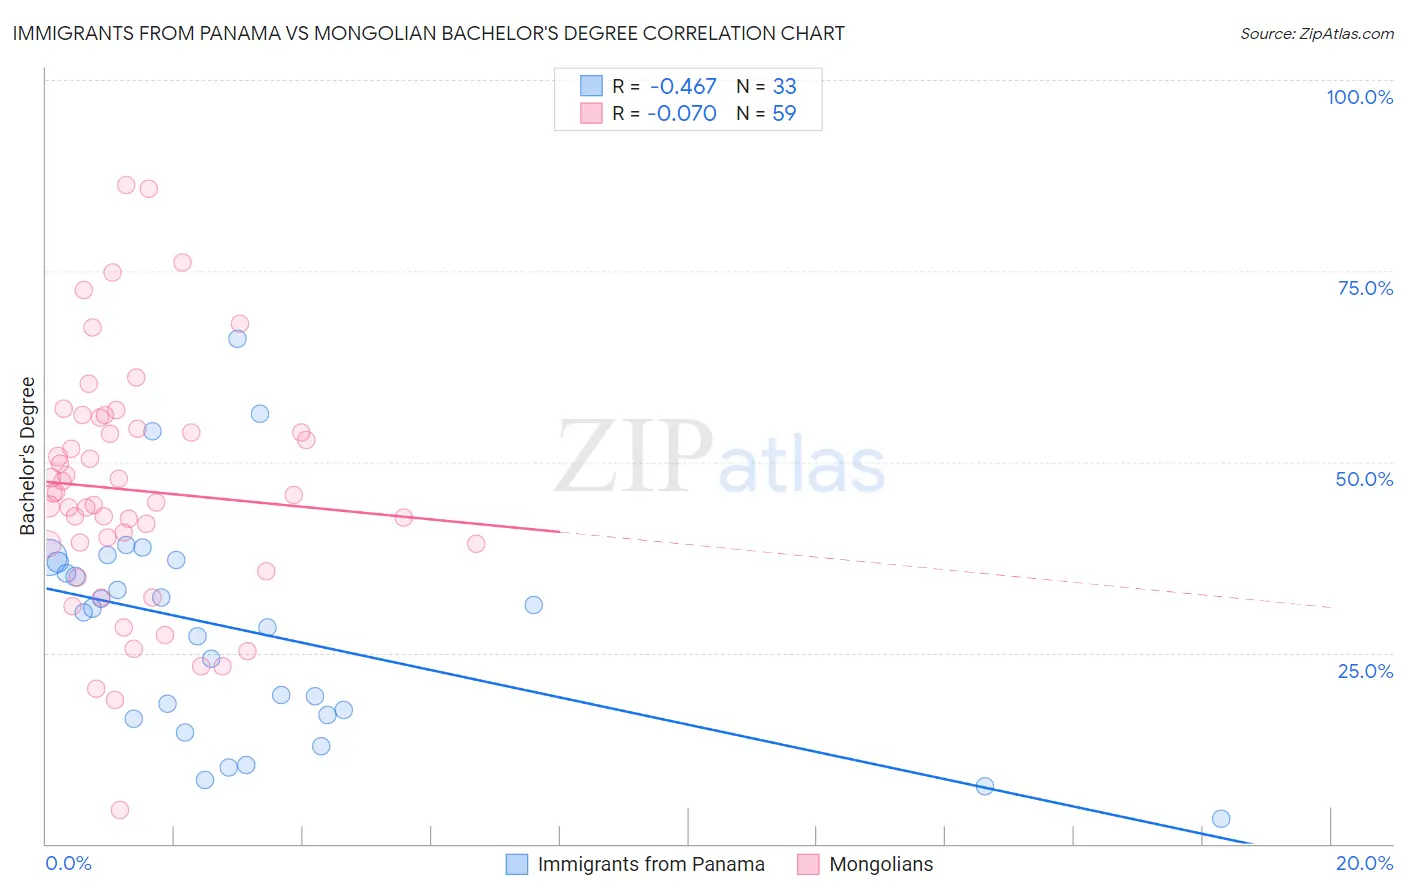
Immigrants from Panama vs Mongolian Bachelor's Degree Correlation Chart
The statistical analysis conducted on geographies consisting of 221,180,522 people shows a moderate negative correlation between the proportion of Immigrants from Panama and percentage of population with at least bachelor's degree education in the United States with a correlation coefficient (R) of -0.467 and weighted average of 36.2%. Similarly, the statistical analysis conducted on geographies consisting of 140,357,131 people shows a slight negative correlation between the proportion of Mongolians and percentage of population with at least bachelor's degree education in the United States with a correlation coefficient (R) of -0.070 and weighted average of 45.4%, a difference of 25.5%.
Bachelor's Degree Correlation Summary
| Measurement | Immigrants from Panama | Mongolian |
| Minimum | 3.2% | 4.5% |
| Maximum | 66.2% | 86.2% |
| Range | 63.0% | 81.7% |
| Mean | 27.8% | 46.3% |
| Median | 30.3% | 45.7% |
| Interquartile 25% (IQ1) | 16.6% | 39.2% |
| Interquartile 75% (IQ3) | 37.0% | 54.3% |
| Interquartile Range (IQR) | 20.5% | 15.0% |
| Standard Deviation (Sample) | 14.6% | 15.9% |
| Standard Deviation (Population) | 14.4% | 15.8% |
Similar Demographics by Bachelor's Degree
Demographics Similar to Immigrants from Panama by Bachelor's Degree
In terms of bachelor's degree, the demographic groups most similar to Immigrants from Panama are German (36.1%, a difference of 0.060%), Immigrants from Western Africa (36.1%, a difference of 0.10%), Barbadian (36.1%, a difference of 0.16%), Immigrants from Philippines (36.4%, a difference of 0.68%), and Scotch-Irish (36.4%, a difference of 0.76%).
| Demographics | Rating | Rank | Bachelor's Degree |
| Spaniards | 21.2 /100 | #206 | Fair 36.6% |
| Immigrants | Middle Africa | 20.6 /100 | #207 | Fair 36.6% |
| Immigrants | Thailand | 19.4 /100 | #208 | Poor 36.5% |
| Panamanians | 18.8 /100 | #209 | Poor 36.5% |
| French | 18.6 /100 | #210 | Poor 36.5% |
| Scotch-Irish | 18.3 /100 | #211 | Poor 36.4% |
| Immigrants | Philippines | 17.8 /100 | #212 | Poor 36.4% |
| Immigrants | Panama | 14.2 /100 | #213 | Poor 36.2% |
| Germans | 13.9 /100 | #214 | Poor 36.1% |
| Immigrants | Western Africa | 13.8 /100 | #215 | Poor 36.1% |
| Barbadians | 13.5 /100 | #216 | Poor 36.1% |
| German Russians | 10.2 /100 | #217 | Poor 35.8% |
| Sub-Saharan Africans | 9.8 /100 | #218 | Tragic 35.8% |
| West Indians | 9.7 /100 | #219 | Tragic 35.8% |
| Spanish | 9.6 /100 | #220 | Tragic 35.8% |
Demographics Similar to Mongolians by Bachelor's Degree
In terms of bachelor's degree, the demographic groups most similar to Mongolians are Immigrants from Russia (45.4%, a difference of 0.020%), Immigrants from Denmark (45.4%, a difference of 0.040%), Russian (45.3%, a difference of 0.15%), Bulgarian (45.3%, a difference of 0.24%), and Immigrants from Northern Europe (45.6%, a difference of 0.50%).
| Demographics | Rating | Rank | Bachelor's Degree |
| Israelis | 100.0 /100 | #29 | Exceptional 46.1% |
| Immigrants | Sri Lanka | 100.0 /100 | #30 | Exceptional 46.1% |
| Latvians | 100.0 /100 | #31 | Exceptional 46.1% |
| Immigrants | Turkey | 100.0 /100 | #32 | Exceptional 46.0% |
| Immigrants | Northern Europe | 100.0 /100 | #33 | Exceptional 45.6% |
| Immigrants | Denmark | 100.0 /100 | #34 | Exceptional 45.4% |
| Immigrants | Russia | 100.0 /100 | #35 | Exceptional 45.4% |
| Mongolians | 100.0 /100 | #36 | Exceptional 45.4% |
| Russians | 100.0 /100 | #37 | Exceptional 45.3% |
| Bulgarians | 100.0 /100 | #38 | Exceptional 45.3% |
| Immigrants | Latvia | 100.0 /100 | #39 | Exceptional 45.1% |
| Immigrants | Belarus | 100.0 /100 | #40 | Exceptional 45.0% |
| Immigrants | Malaysia | 100.0 /100 | #41 | Exceptional 45.0% |
| Immigrants | Saudi Arabia | 100.0 /100 | #42 | Exceptional 44.8% |
| Immigrants | South Africa | 99.9 /100 | #43 | Exceptional 44.8% |