Iranian vs Immigrants from Nepal Bachelor's Degree
COMPARE
Iranian
Immigrants from Nepal
Bachelor's Degree
Bachelor's Degree Comparison
Iranians
Immigrants from Nepal
51.0%
BACHELOR'S DEGREE
100.0/ 100
METRIC RATING
5th/ 347
METRIC RANK
41.7%
BACHELOR'S DEGREE
98.6/ 100
METRIC RATING
94th/ 347
METRIC RANK
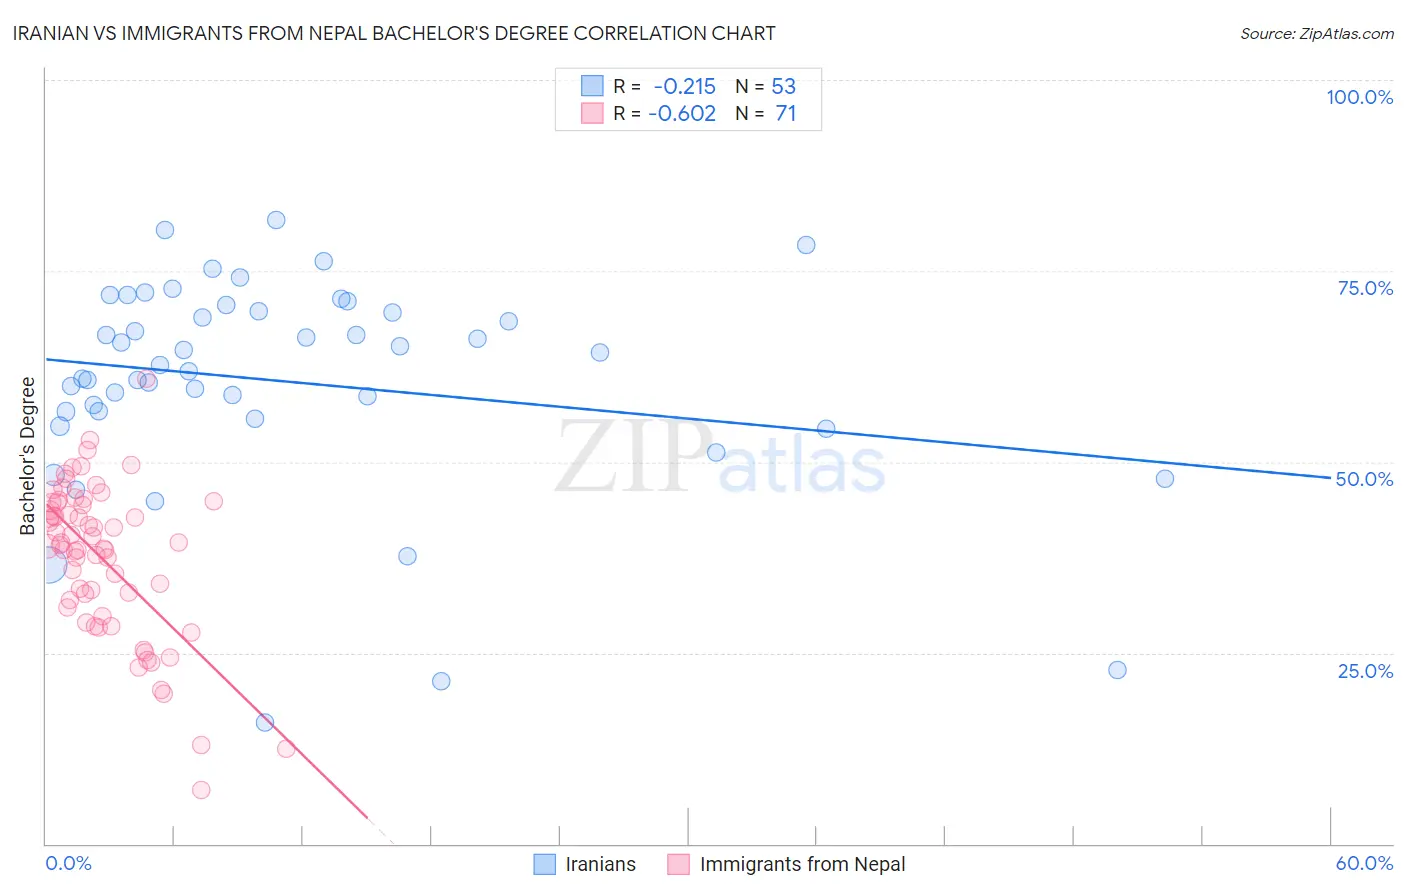
Iranian vs Immigrants from Nepal Bachelor's Degree Correlation Chart
The statistical analysis conducted on geographies consisting of 316,876,001 people shows a weak negative correlation between the proportion of Iranians and percentage of population with at least bachelor's degree education in the United States with a correlation coefficient (R) of -0.215 and weighted average of 51.0%. Similarly, the statistical analysis conducted on geographies consisting of 186,767,896 people shows a significant negative correlation between the proportion of Immigrants from Nepal and percentage of population with at least bachelor's degree education in the United States with a correlation coefficient (R) of -0.602 and weighted average of 41.7%, a difference of 22.2%.
Bachelor's Degree Correlation Summary
| Measurement | Iranian | Immigrants from Nepal |
| Minimum | 15.8% | 7.0% |
| Maximum | 81.6% | 60.9% |
| Range | 65.8% | 53.9% |
| Mean | 60.5% | 37.3% |
| Median | 62.7% | 39.2% |
| Interquartile 25% (IQ1) | 56.1% | 30.9% |
| Interquartile 75% (IQ3) | 70.1% | 44.6% |
| Interquartile Range (IQR) | 14.0% | 13.7% |
| Standard Deviation (Sample) | 14.1% | 10.1% |
| Standard Deviation (Population) | 13.9% | 10.0% |
Similar Demographics by Bachelor's Degree
Demographics Similar to Iranians by Bachelor's Degree
In terms of bachelor's degree, the demographic groups most similar to Iranians are Immigrants from Taiwan (51.2%, a difference of 0.42%), Immigrants from India (51.3%, a difference of 0.63%), Okinawan (50.5%, a difference of 0.84%), Immigrants from Iran (50.3%, a difference of 1.3%), and Thai (50.1%, a difference of 1.7%).
| Demographics | Rating | Rank | Bachelor's Degree |
| Filipinos | 100.0 /100 | #1 | Exceptional 52.7% |
| Immigrants | Singapore | 100.0 /100 | #2 | Exceptional 51.9% |
| Immigrants | India | 100.0 /100 | #3 | Exceptional 51.3% |
| Immigrants | Taiwan | 100.0 /100 | #4 | Exceptional 51.2% |
| Iranians | 100.0 /100 | #5 | Exceptional 51.0% |
| Okinawans | 100.0 /100 | #6 | Exceptional 50.5% |
| Immigrants | Iran | 100.0 /100 | #7 | Exceptional 50.3% |
| Thais | 100.0 /100 | #8 | Exceptional 50.1% |
| Immigrants | Israel | 100.0 /100 | #9 | Exceptional 50.0% |
| Cypriots | 100.0 /100 | #10 | Exceptional 49.0% |
| Immigrants | Australia | 100.0 /100 | #11 | Exceptional 48.5% |
| Immigrants | China | 100.0 /100 | #12 | Exceptional 48.4% |
| Immigrants | South Central Asia | 100.0 /100 | #13 | Exceptional 48.3% |
| Immigrants | Hong Kong | 100.0 /100 | #14 | Exceptional 48.2% |
| Immigrants | Eastern Asia | 100.0 /100 | #15 | Exceptional 48.1% |
Demographics Similar to Immigrants from Nepal by Bachelor's Degree
In terms of bachelor's degree, the demographic groups most similar to Immigrants from Nepal are Immigrants from Canada (41.7%, a difference of 0.020%), Immigrants from North America (41.7%, a difference of 0.12%), Immigrants from Moldova (41.6%, a difference of 0.23%), Romanian (41.6%, a difference of 0.29%), and Immigrants from Ukraine (41.5%, a difference of 0.40%).
| Demographics | Rating | Rank | Bachelor's Degree |
| Carpatho Rusyns | 99.0 /100 | #87 | Exceptional 42.1% |
| Immigrants | Western Europe | 99.0 /100 | #88 | Exceptional 42.0% |
| Greeks | 99.0 /100 | #89 | Exceptional 42.0% |
| Laotians | 98.9 /100 | #90 | Exceptional 42.0% |
| Immigrants | Northern Africa | 98.9 /100 | #91 | Exceptional 41.9% |
| Maltese | 98.8 /100 | #92 | Exceptional 41.9% |
| Immigrants | Canada | 98.6 /100 | #93 | Exceptional 41.7% |
| Immigrants | Nepal | 98.6 /100 | #94 | Exceptional 41.7% |
| Immigrants | North America | 98.5 /100 | #95 | Exceptional 41.7% |
| Immigrants | Moldova | 98.4 /100 | #96 | Exceptional 41.6% |
| Romanians | 98.4 /100 | #97 | Exceptional 41.6% |
| Immigrants | Ukraine | 98.3 /100 | #98 | Exceptional 41.5% |
| Immigrants | England | 98.1 /100 | #99 | Exceptional 41.4% |
| Macedonians | 98.1 /100 | #100 | Exceptional 41.4% |
| Immigrants | Morocco | 98.0 /100 | #101 | Exceptional 41.4% |