Iranian vs Slovak Bachelor's Degree
COMPARE
Iranian
Slovak
Bachelor's Degree
Bachelor's Degree Comparison
Iranians
Slovaks
51.0%
BACHELOR'S DEGREE
100.0/ 100
METRIC RATING
5th/ 347
METRIC RANK
37.3%
BACHELOR'S DEGREE
36.9/ 100
METRIC RATING
189th/ 347
METRIC RANK
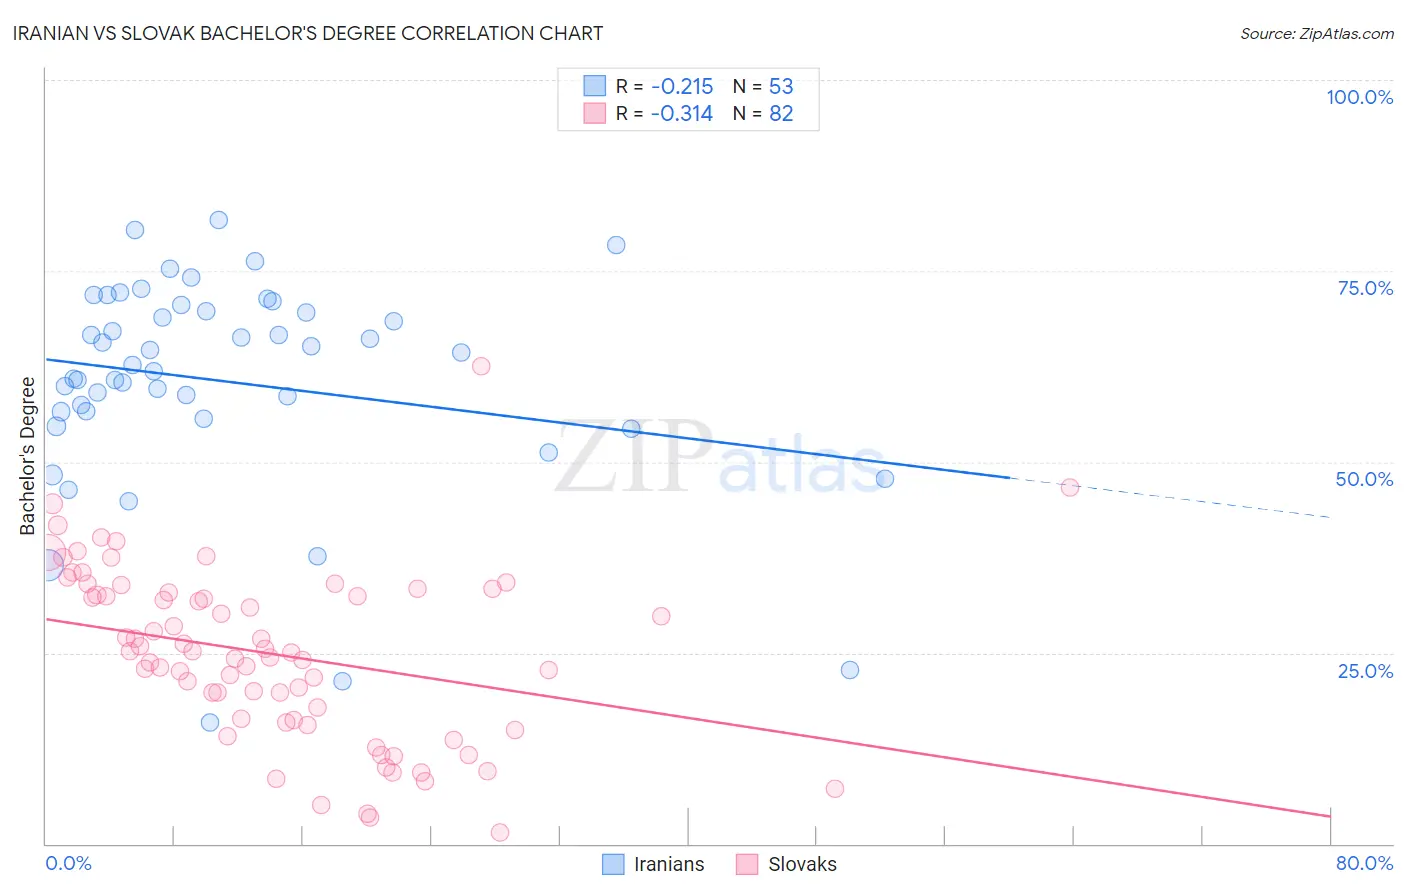
Iranian vs Slovak Bachelor's Degree Correlation Chart
The statistical analysis conducted on geographies consisting of 316,876,001 people shows a weak negative correlation between the proportion of Iranians and percentage of population with at least bachelor's degree education in the United States with a correlation coefficient (R) of -0.215 and weighted average of 51.0%. Similarly, the statistical analysis conducted on geographies consisting of 397,863,684 people shows a mild negative correlation between the proportion of Slovaks and percentage of population with at least bachelor's degree education in the United States with a correlation coefficient (R) of -0.314 and weighted average of 37.3%, a difference of 36.5%.
Bachelor's Degree Correlation Summary
| Measurement | Iranian | Slovak |
| Minimum | 15.8% | 1.5% |
| Maximum | 81.6% | 62.5% |
| Range | 65.8% | 61.0% |
| Mean | 60.5% | 24.8% |
| Median | 62.7% | 25.1% |
| Interquartile 25% (IQ1) | 56.1% | 16.2% |
| Interquartile 75% (IQ3) | 70.1% | 32.9% |
| Interquartile Range (IQR) | 14.0% | 16.7% |
| Standard Deviation (Sample) | 14.1% | 11.3% |
| Standard Deviation (Population) | 13.9% | 11.3% |
Similar Demographics by Bachelor's Degree
Demographics Similar to Iranians by Bachelor's Degree
In terms of bachelor's degree, the demographic groups most similar to Iranians are Immigrants from Taiwan (51.2%, a difference of 0.42%), Immigrants from India (51.3%, a difference of 0.63%), Okinawan (50.5%, a difference of 0.84%), Immigrants from Iran (50.3%, a difference of 1.3%), and Thai (50.1%, a difference of 1.7%).
| Demographics | Rating | Rank | Bachelor's Degree |
| Filipinos | 100.0 /100 | #1 | Exceptional 52.7% |
| Immigrants | Singapore | 100.0 /100 | #2 | Exceptional 51.9% |
| Immigrants | India | 100.0 /100 | #3 | Exceptional 51.3% |
| Immigrants | Taiwan | 100.0 /100 | #4 | Exceptional 51.2% |
| Iranians | 100.0 /100 | #5 | Exceptional 51.0% |
| Okinawans | 100.0 /100 | #6 | Exceptional 50.5% |
| Immigrants | Iran | 100.0 /100 | #7 | Exceptional 50.3% |
| Thais | 100.0 /100 | #8 | Exceptional 50.1% |
| Immigrants | Israel | 100.0 /100 | #9 | Exceptional 50.0% |
| Cypriots | 100.0 /100 | #10 | Exceptional 49.0% |
| Immigrants | Australia | 100.0 /100 | #11 | Exceptional 48.5% |
| Immigrants | China | 100.0 /100 | #12 | Exceptional 48.4% |
| Immigrants | South Central Asia | 100.0 /100 | #13 | Exceptional 48.3% |
| Immigrants | Hong Kong | 100.0 /100 | #14 | Exceptional 48.2% |
| Immigrants | Eastern Asia | 100.0 /100 | #15 | Exceptional 48.1% |
Demographics Similar to Slovaks by Bachelor's Degree
In terms of bachelor's degree, the demographic groups most similar to Slovaks are Immigrants from Oceania (37.3%, a difference of 0.050%), English (37.4%, a difference of 0.29%), Swiss (37.2%, a difference of 0.30%), Nigerian (37.2%, a difference of 0.32%), and Norwegian (37.5%, a difference of 0.36%).
| Demographics | Rating | Rank | Bachelor's Degree |
| Immigrants | Bosnia and Herzegovina | 43.4 /100 | #182 | Average 37.6% |
| Senegalese | 42.2 /100 | #183 | Average 37.5% |
| Scandinavians | 41.7 /100 | #184 | Average 37.5% |
| Immigrants | Peru | 41.3 /100 | #185 | Average 37.5% |
| Norwegians | 40.4 /100 | #186 | Average 37.5% |
| English | 39.7 /100 | #187 | Fair 37.4% |
| Immigrants | Oceania | 37.3 /100 | #188 | Fair 37.3% |
| Slovaks | 36.9 /100 | #189 | Fair 37.3% |
| Swiss | 34.1 /100 | #190 | Fair 37.2% |
| Nigerians | 33.9 /100 | #191 | Fair 37.2% |
| Immigrants | Vietnam | 32.1 /100 | #192 | Fair 37.1% |
| Yugoslavians | 31.5 /100 | #193 | Fair 37.1% |
| Belgians | 29.9 /100 | #194 | Fair 37.0% |
| Koreans | 29.8 /100 | #195 | Fair 37.0% |
| Celtics | 29.5 /100 | #196 | Fair 37.0% |