Iranian vs Immigrants from Senegal Bachelor's Degree
COMPARE
Iranian
Immigrants from Senegal
Bachelor's Degree
Bachelor's Degree Comparison
Iranians
Immigrants from Senegal
51.0%
BACHELOR'S DEGREE
100.0/ 100
METRIC RATING
5th/ 347
METRIC RANK
37.6%
BACHELOR'S DEGREE
43.8/ 100
METRIC RATING
181st/ 347
METRIC RANK
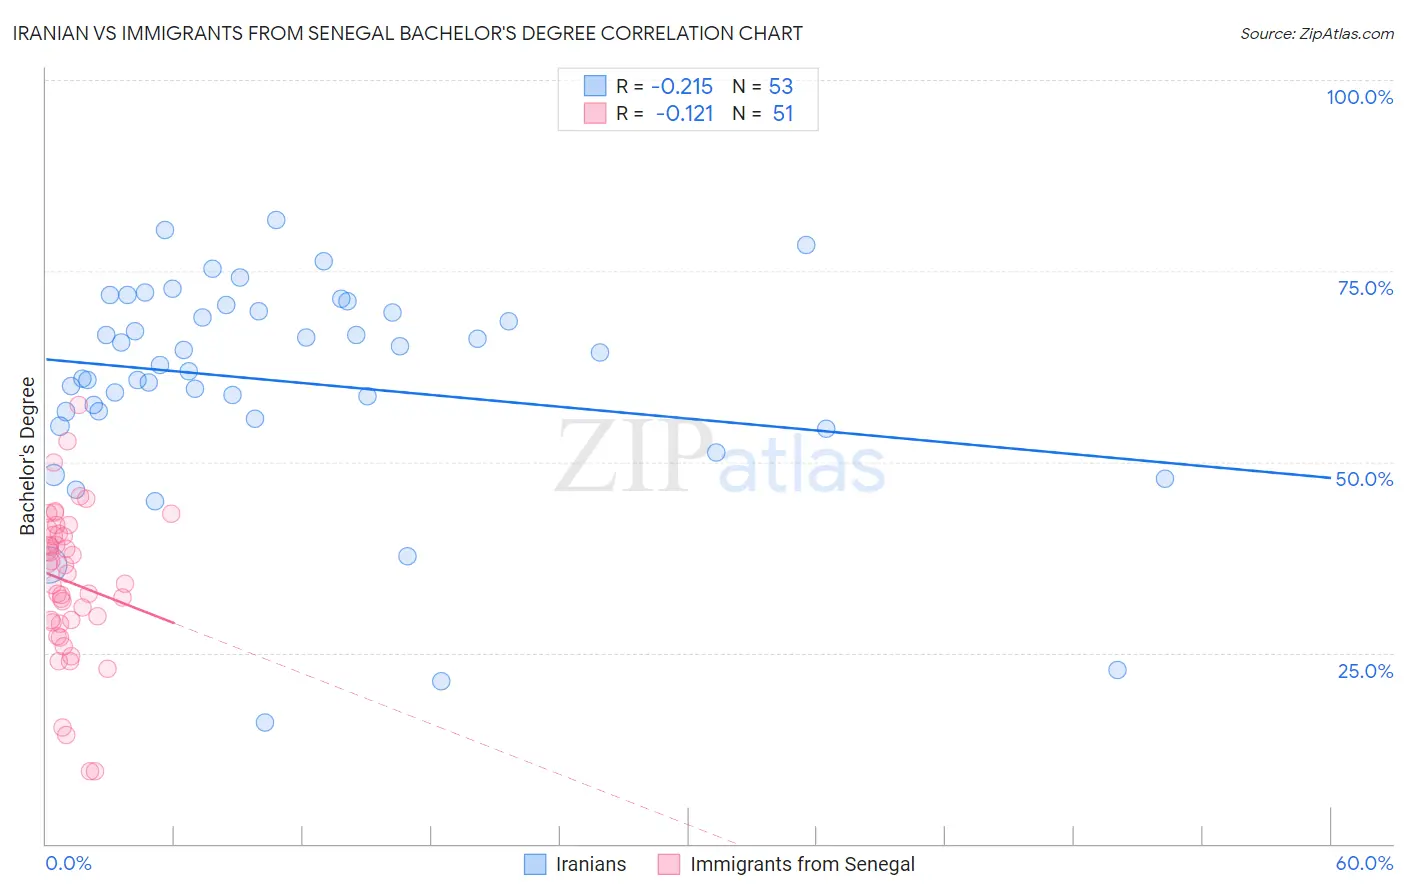
Iranian vs Immigrants from Senegal Bachelor's Degree Correlation Chart
The statistical analysis conducted on geographies consisting of 316,876,001 people shows a weak negative correlation between the proportion of Iranians and percentage of population with at least bachelor's degree education in the United States with a correlation coefficient (R) of -0.215 and weighted average of 51.0%. Similarly, the statistical analysis conducted on geographies consisting of 90,125,204 people shows a poor negative correlation between the proportion of Immigrants from Senegal and percentage of population with at least bachelor's degree education in the United States with a correlation coefficient (R) of -0.121 and weighted average of 37.6%, a difference of 35.6%.
Bachelor's Degree Correlation Summary
| Measurement | Iranian | Immigrants from Senegal |
| Minimum | 15.8% | 9.5% |
| Maximum | 81.6% | 57.5% |
| Range | 65.8% | 48.0% |
| Mean | 60.5% | 34.3% |
| Median | 62.7% | 35.4% |
| Interquartile 25% (IQ1) | 56.1% | 29.0% |
| Interquartile 75% (IQ3) | 70.1% | 40.6% |
| Interquartile Range (IQR) | 14.0% | 11.6% |
| Standard Deviation (Sample) | 14.1% | 9.9% |
| Standard Deviation (Population) | 13.9% | 9.8% |
Similar Demographics by Bachelor's Degree
Demographics Similar to Iranians by Bachelor's Degree
In terms of bachelor's degree, the demographic groups most similar to Iranians are Immigrants from Taiwan (51.2%, a difference of 0.42%), Immigrants from India (51.3%, a difference of 0.63%), Okinawan (50.5%, a difference of 0.84%), Immigrants from Iran (50.3%, a difference of 1.3%), and Thai (50.1%, a difference of 1.7%).
| Demographics | Rating | Rank | Bachelor's Degree |
| Filipinos | 100.0 /100 | #1 | Exceptional 52.7% |
| Immigrants | Singapore | 100.0 /100 | #2 | Exceptional 51.9% |
| Immigrants | India | 100.0 /100 | #3 | Exceptional 51.3% |
| Immigrants | Taiwan | 100.0 /100 | #4 | Exceptional 51.2% |
| Iranians | 100.0 /100 | #5 | Exceptional 51.0% |
| Okinawans | 100.0 /100 | #6 | Exceptional 50.5% |
| Immigrants | Iran | 100.0 /100 | #7 | Exceptional 50.3% |
| Thais | 100.0 /100 | #8 | Exceptional 50.1% |
| Immigrants | Israel | 100.0 /100 | #9 | Exceptional 50.0% |
| Cypriots | 100.0 /100 | #10 | Exceptional 49.0% |
| Immigrants | Australia | 100.0 /100 | #11 | Exceptional 48.5% |
| Immigrants | China | 100.0 /100 | #12 | Exceptional 48.4% |
| Immigrants | South Central Asia | 100.0 /100 | #13 | Exceptional 48.3% |
| Immigrants | Hong Kong | 100.0 /100 | #14 | Exceptional 48.2% |
| Immigrants | Eastern Asia | 100.0 /100 | #15 | Exceptional 48.1% |
Demographics Similar to Immigrants from Senegal by Bachelor's Degree
In terms of bachelor's degree, the demographic groups most similar to Immigrants from Senegal are Immigrants from Bosnia and Herzegovina (37.6%, a difference of 0.030%), Irish (37.6%, a difference of 0.050%), Immigrants from Colombia (37.7%, a difference of 0.16%), Senegalese (37.5%, a difference of 0.16%), and Scandinavian (37.5%, a difference of 0.20%).
| Demographics | Rating | Rank | Bachelor's Degree |
| Immigrants | Bangladesh | 50.0 /100 | #174 | Average 37.8% |
| Immigrants | Uruguay | 48.3 /100 | #175 | Average 37.8% |
| Costa Ricans | 47.6 /100 | #176 | Average 37.7% |
| Basques | 47.4 /100 | #177 | Average 37.7% |
| Immigrants | Cameroon | 46.8 /100 | #178 | Average 37.7% |
| Immigrants | Colombia | 45.4 /100 | #179 | Average 37.7% |
| Irish | 44.3 /100 | #180 | Average 37.6% |
| Immigrants | Senegal | 43.8 /100 | #181 | Average 37.6% |
| Immigrants | Bosnia and Herzegovina | 43.4 /100 | #182 | Average 37.6% |
| Senegalese | 42.2 /100 | #183 | Average 37.5% |
| Scandinavians | 41.7 /100 | #184 | Average 37.5% |
| Immigrants | Peru | 41.3 /100 | #185 | Average 37.5% |
| Norwegians | 40.4 /100 | #186 | Average 37.5% |
| English | 39.7 /100 | #187 | Fair 37.4% |
| Immigrants | Oceania | 37.3 /100 | #188 | Fair 37.3% |