Iranian vs Peruvian Bachelor's Degree

COMPARE

Iranian
Race
Ancestry
AfghanAfricanAlaska NativeAlaskan AthabascanAlbanianAleutAlsatianAmericanApacheArabArapahoArgentineanArmenianAssyrian/Chaldean/SyriacAustralianAustrianBahamianBangladeshiBarbadianBasqueBelgianBelizeanBermudanBhutaneseBlackfeetBolivianBrazilianBritishBritish West IndianBulgarianBurmeseCajunCambodianCanadianCape VerdeanCarpatho RusynCelticCentral AmericanCentral American IndianCherokeeCheyenneChickasawChileanChineseChippewaChoctawColombianColvilleComancheCosta RicanCreeCreekCroatianCrowCubanCypriotCzechCzechoslovakianDanishDelawareDominicanDutchDutch West IndianEastern EuropeanEcuadorianEgyptianEnglishEstonianEthiopianEuropeanFijianFilipinoFinnishFrenchFrench American IndianFrench CanadianGermanGerman RussianGhanaianGreekGuamanian/ChamorroGuatemalanGuyaneseHaitianHmongHonduranHopiHoumaHungarianIcelanderIndian (Asian)IndonesianInupiatIranianIraqiIrishIroquoisIsraeliItalianJamaicanJapaneseJordanianKenyanKiowaKoreanLaotianLatvianLebaneseLiberianLithuanianLumbeeLuxembourgerMacedonianMalaysianMalteseMarshalleseMenomineeMexicanMexican American IndianMongolianMoroccanNative HawaiianNavajoNepaleseNew ZealanderNicaraguanNigerianNorthern EuropeanNorwegianOkinawanOsageOttawaPaiutePakistaniPalestinianPanamanianParaguayanPennsylvania GermanPimaPolishPortuguesePotawatomiPuebloPuerto RicanPuget Sound SalishRomanianRussianSalvadoranSamoanScandinavianScotch-IrishScottishSeminoleSenegaleseSerbianShoshoneSierra LeoneanSiouxSlavicSlovakSloveneSomaliSouth AfricanSouth AmericanSouth American IndianSoviet UnionSpaniardSpanishSpanish AmericanSpanish American IndianSri LankanSubsaharan AfricanSudaneseSwedishSwissSyrianTaiwaneseThaiTlingit-HaidaTohono O'OdhamTonganTrinidadian and TobagonianTsimshianTurkishU.S. Virgin IslanderUgandanUkrainianUruguayanUteVenezuelanVietnameseWelshWest IndianYakamaYaquiYugoslavianYumanYup'ikZimbabwean
Immigration
NonimmigrantsImmigrantsAfghanistanAfricaAlbaniaArgentinaArmeniaAsiaAustraliaAustriaBahamasBangladeshBarbadosBelarusBelgiumBelizeBoliviaBosnia and HerzegovinaBrazilBulgariaBurma/MyanmarCabo VerdeCambodiaCameroonCanadaCaribbeanCentral AmericaChileChinaColombiaCongoCosta RicaCroatiaCubaCzechoslovakiaDenmarkDominicaDominican RepublicEastern AfricaEastern AsiaEastern EuropeEcuadorEgyptEl SalvadorEnglandEritreaEthiopiaEuropeFijiFranceGermanyGhanaGreeceGrenadaGuatemalaGuyanaHaitiHondurasHong KongHungaryIndiaIndonesiaIranIraqIrelandIsraelItalyJamaicaJapanJordanKazakhstanKenyaKoreaKuwaitLaosLatin AmericaLatviaLebanonLiberiaLithuaniaMalaysiaMexicoMicronesiaMiddle AfricaMoldovaMoroccoNepalNetherlandsNicaraguaNigeriaNorth AmericaNorth MacedoniaNorthern AfricaNorthern EuropeNorwayOceaniaPakistanPanamaPeruPhilippinesPolandPortugalRomaniaRussiaSaudi ArabiaScotlandSenegalSerbiaSierra LeoneSingaporeSomaliaSouth AfricaSouth AmericaSouth Central AsiaSouth Eastern AsiaSouthern EuropeSpainSri LankaSt. Vincent and the GrenadinesSudanSwedenSwitzerlandSyriaTaiwanThailandTrinidad and TobagoTurkeyUgandaUkraineUruguayUzbekistanVenezuelaVietnamWest IndiesWestern AfricaWestern AsiaWestern EuropeYemenZaireZimbabweAzores
Peruvian
Race
Ancestry
AfghanAfricanAlaska NativeAlaskan AthabascanAlbanianAleutAlsatianAmericanApacheArabArapahoArgentineanArmenianAssyrian/Chaldean/SyriacAustralianAustrianBahamianBangladeshiBarbadianBasqueBelgianBelizeanBermudanBhutaneseBlackfeetBolivianBrazilianBritishBritish West IndianBulgarianBurmeseCajunCambodianCanadianCape VerdeanCarpatho RusynCelticCentral AmericanCentral American IndianCherokeeCheyenneChickasawChileanChineseChippewaChoctawColombianColvilleComancheCosta RicanCreeCreekCroatianCrowCubanCypriotCzechCzechoslovakianDanishDelawareDominicanDutchDutch West IndianEastern EuropeanEcuadorianEgyptianEnglishEstonianEthiopianEuropeanFijianFilipinoFinnishFrenchFrench American IndianFrench CanadianGermanGerman RussianGhanaianGreekGuamanian/ChamorroGuatemalanGuyaneseHaitianHmongHonduranHopiHoumaHungarianIcelanderIndian (Asian)IndonesianInupiatIraqiIrishIroquoisIsraeliItalianJamaicanJapaneseJordanianKenyanKiowaKoreanLaotianLatvianLebaneseLiberianLithuanianLumbeeLuxembourgerMacedonianMalaysianMalteseMarshalleseMenomineeMexicanMexican American IndianMongolianMoroccanNative HawaiianNavajoNepaleseNew ZealanderNicaraguanNigerianNorthern EuropeanNorwegianOkinawanOsageOttawaPaiutePakistaniPalestinianPanamanianParaguayanPennsylvania GermanPeruvianPimaPolishPortuguesePotawatomiPuebloPuerto RicanPuget Sound SalishRomanianRussianSalvadoranSamoanScandinavianScotch-IrishScottishSeminoleSenegaleseSerbianShoshoneSierra LeoneanSiouxSlavicSlovakSloveneSomaliSouth AfricanSouth AmericanSouth American IndianSoviet UnionSpaniardSpanishSpanish AmericanSpanish American IndianSri LankanSubsaharan AfricanSudaneseSwedishSwissSyrianTaiwaneseThaiTlingit-HaidaTohono O'OdhamTonganTrinidadian and TobagonianTsimshianTurkishU.S. Virgin IslanderUgandanUkrainianUruguayanUteVenezuelanVietnameseWelshWest IndianYakamaYaquiYugoslavianYumanYup'ikZimbabwean
Immigration
NonimmigrantsImmigrantsAfghanistanAfricaAlbaniaArgentinaArmeniaAsiaAustraliaAustriaBahamasBangladeshBarbadosBelarusBelgiumBelizeBoliviaBosnia and HerzegovinaBrazilBulgariaBurma/MyanmarCabo VerdeCambodiaCameroonCanadaCaribbeanCentral AmericaChileChinaColombiaCongoCosta RicaCroatiaCubaCzechoslovakiaDenmarkDominicaDominican RepublicEastern AfricaEastern AsiaEastern EuropeEcuadorEgyptEl SalvadorEnglandEritreaEthiopiaEuropeFijiFranceGermanyGhanaGreeceGrenadaGuatemalaGuyanaHaitiHondurasHong KongHungaryIndiaIndonesiaIranIraqIrelandIsraelItalyJamaicaJapanJordanKazakhstanKenyaKoreaKuwaitLaosLatin AmericaLatviaLebanonLiberiaLithuaniaMalaysiaMexicoMicronesiaMiddle AfricaMoldovaMoroccoNepalNetherlandsNicaraguaNigeriaNorth AmericaNorth MacedoniaNorthern AfricaNorthern EuropeNorwayOceaniaPakistanPanamaPeruPhilippinesPolandPortugalRomaniaRussiaSaudi ArabiaScotlandSenegalSerbiaSierra LeoneSingaporeSomaliaSouth AfricaSouth AmericaSouth Central AsiaSouth Eastern AsiaSouthern EuropeSpainSri LankaSt. Vincent and the GrenadinesSudanSwedenSwitzerlandSyriaTaiwanThailandTrinidad and TobagoTurkeyUgandaUkraineUruguayUzbekistanVenezuelaVietnamWest IndiesWestern AfricaWestern AsiaWestern EuropeYemenZaireZimbabweAzores
Bachelor's Degree
Income
Poverty
Unemployment
Labor Participation
Family Structure
Vehicle Availability
Education Level
Disability

Bachelor's Degree Comparison

Iranians

Peruvians

Exceptional
Good
51.0%
BACHELOR'S DEGREE
100.0/ 100
METRIC RATING
5th/ 347
METRIC RANK
38.3%
BACHELOR'S DEGREE
63.4/ 100
METRIC RATING
163rd/ 347
METRIC RANK

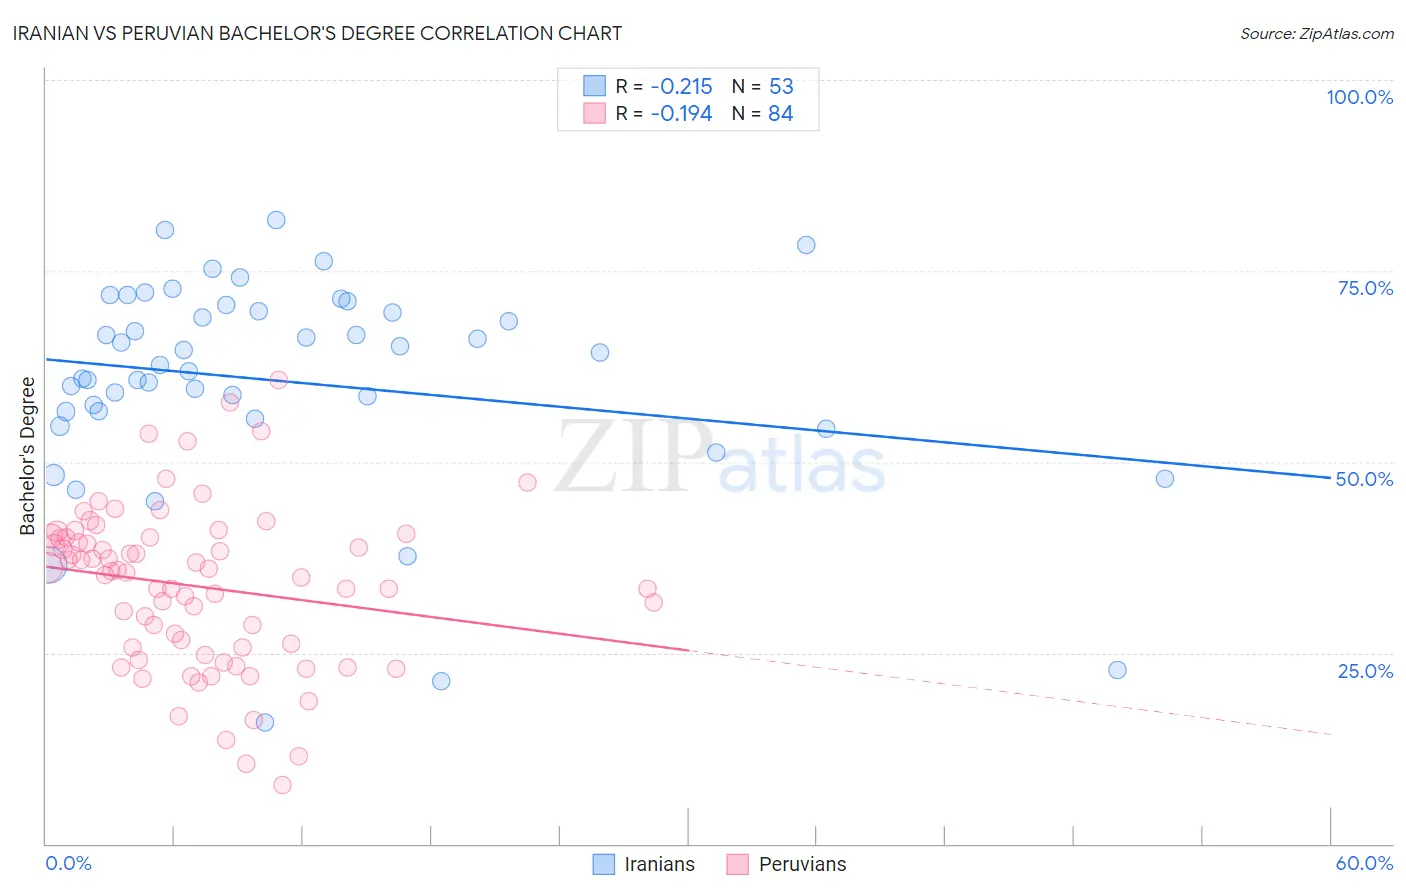
Iranian vs Peruvian Bachelor's Degree Correlation Chart

The statistical analysis conducted on geographies consisting of 316,876,001 people shows a weak negative correlation between the proportion of Iranians and percentage of population with at least bachelor's degree education in the United States with a correlation coefficient (R) of -0.215 and weighted average of 51.0%. Similarly, the statistical analysis conducted on geographies consisting of 363,225,668 people shows a poor negative correlation between the proportion of Peruvians and percentage of population with at least bachelor's degree education in the United States with a correlation coefficient (R) of -0.194 and weighted average of 38.3%, a difference of 33.0%.
Iranian vs Peruvian Bachelor's Degree

Bachelor's Degree Correlation Summary

MeasurementIranianPeruvian
Minimum15.8%7.6%
Maximum81.6%60.7%
Range65.8%53.0%
Mean60.5%33.7%
Median62.7%35.6%
Interquartile 25% (IQ1)56.1%25.6%
Interquartile 75% (IQ3)70.1%40.1%
Interquartile Range (IQR)14.0%14.5%
Standard Deviation (Sample)14.1%10.5%
Standard Deviation (Population)13.9%10.5%

Similar Demographics by Bachelor's Degree

Demographics Similar to Iranians by Bachelor's Degree

In terms of bachelor's degree, the demographic groups most similar to Iranians are Immigrants from Taiwan (51.2%, a difference of 0.42%), Immigrants from India (51.3%, a difference of 0.63%), Okinawan (50.5%, a difference of 0.84%), Immigrants from Iran (50.3%, a difference of 1.3%), and Thai (50.1%, a difference of 1.7%).
DemographicsRating | RankBachelor's Degree
Filipinos
100.0
/100
|
#1
Exceptional
52.7%
Immigrants | Singapore
100.0
/100
|
#2
Exceptional
51.9%
Immigrants | India
100.0
/100
|
#3
Exceptional
51.3%
Immigrants | Taiwan
100.0
/100
|
#4
Exceptional
51.2%
Iranians
100.0
/100
|
#5
Exceptional
51.0%
Okinawans
100.0
/100
|
#6
Exceptional
50.5%
Immigrants | Iran
100.0
/100
|
#7
Exceptional
50.3%
Thais
100.0
/100
|
#8
Exceptional
50.1%
Immigrants | Israel
100.0
/100
|
#9
Exceptional
50.0%
Cypriots
100.0
/100
|
#10
Exceptional
49.0%
Immigrants | Australia
100.0
/100
|
#11
Exceptional
48.5%
Immigrants | China
100.0
/100
|
#12
Exceptional
48.4%
Immigrants | South Central Asia
100.0
/100
|
#13
Exceptional
48.3%
Immigrants | Hong Kong
100.0
/100
|
#14
Exceptional
48.2%
Immigrants | Eastern Asia
100.0
/100
|
#15
Exceptional
48.1%

Demographics Similar to Peruvians by Bachelor's Degree

In terms of bachelor's degree, the demographic groups most similar to Peruvians are Hungarian (38.3%, a difference of 0.14%), Colombian (38.4%, a difference of 0.17%), Uruguayan (38.4%, a difference of 0.25%), Vietnamese (38.5%, a difference of 0.33%), and Chinese (38.5%, a difference of 0.34%).
DemographicsRating | RankBachelor's Degree
Kenyans
72.5
/100
|
#156
Good
38.7%
Immigrants | South America
70.1
/100
|
#157
Good
38.6%
Immigrants | Germany
69.6
/100
|
#158
Good
38.6%
Chinese
66.6
/100
|
#159
Good
38.5%
Vietnamese
66.6
/100
|
#160
Good
38.5%
Uruguayans
65.8
/100
|
#161
Good
38.4%
Colombians
65.0
/100
|
#162
Good
38.4%
Peruvians
63.4
/100
|
#163
Good
38.3%
Hungarians
62.1
/100
|
#164
Good
38.3%
Sri Lankans
59.1
/100
|
#165
Average
38.2%
Somalis
58.6
/100
|
#166
Average
38.1%
Scottish
56.6
/100
|
#167
Average
38.1%
Danes
56.2
/100
|
#168
Average
38.1%
Ghanaians
55.3
/100
|
#169
Average
38.0%
Czechs
54.4
/100
|
#170
Average
38.0%