Immigrants from Philippines vs Immigrants from Eritrea Bachelor's Degree
COMPARE
Immigrants from Philippines
Immigrants from Eritrea
Bachelor's Degree
Bachelor's Degree Comparison
Immigrants from Philippines
Immigrants from Eritrea
36.4%
BACHELOR'S DEGREE
17.8/ 100
METRIC RATING
212th/ 347
METRIC RANK
40.4%
BACHELOR'S DEGREE
94.3/ 100
METRIC RATING
124th/ 347
METRIC RANK
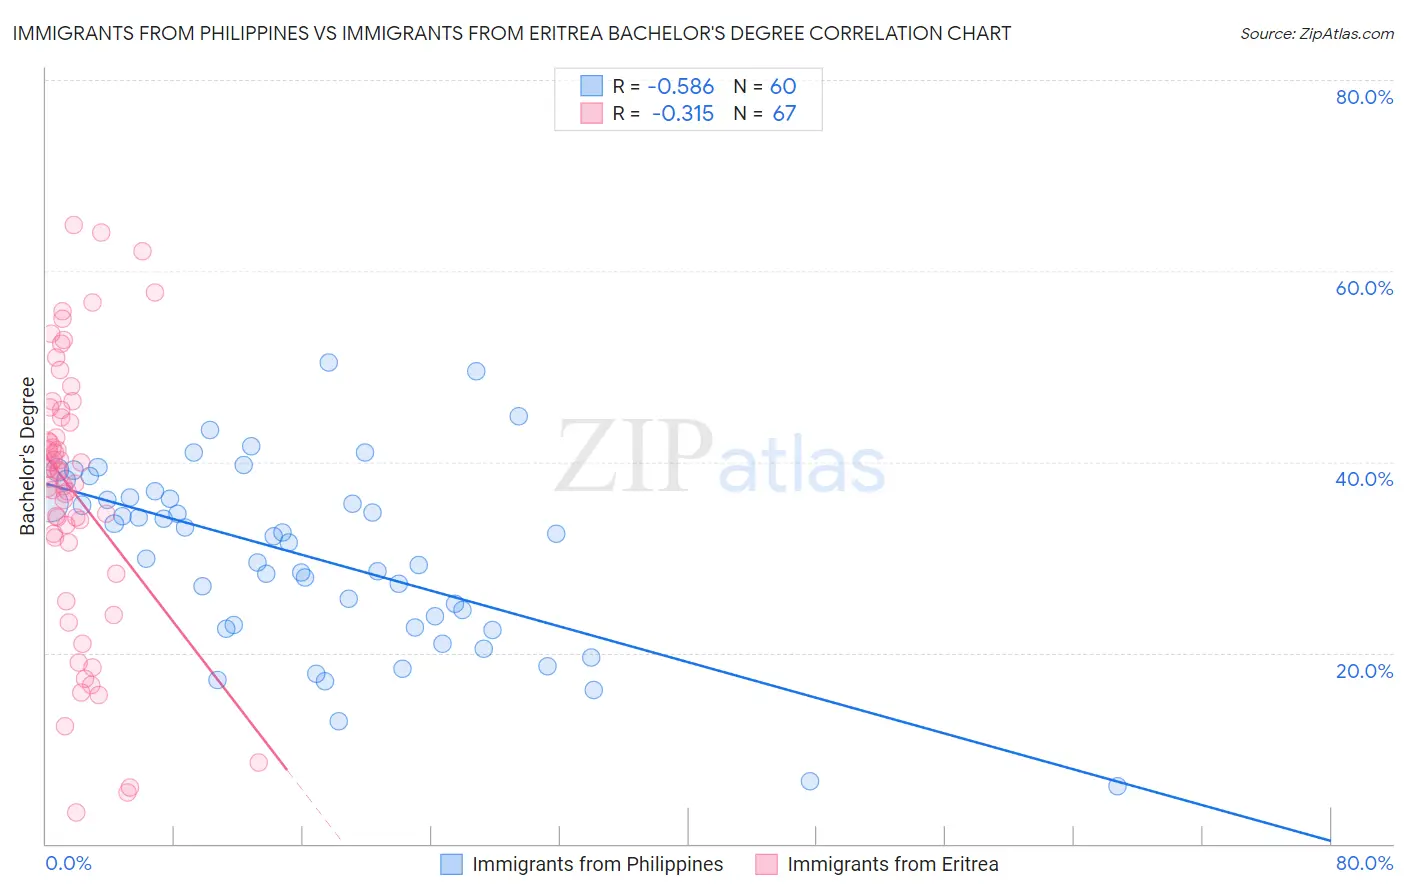
Immigrants from Philippines vs Immigrants from Eritrea Bachelor's Degree Correlation Chart
The statistical analysis conducted on geographies consisting of 471,284,617 people shows a substantial negative correlation between the proportion of Immigrants from Philippines and percentage of population with at least bachelor's degree education in the United States with a correlation coefficient (R) of -0.586 and weighted average of 36.4%. Similarly, the statistical analysis conducted on geographies consisting of 104,855,166 people shows a mild negative correlation between the proportion of Immigrants from Eritrea and percentage of population with at least bachelor's degree education in the United States with a correlation coefficient (R) of -0.315 and weighted average of 40.4%, a difference of 11.0%.
Bachelor's Degree Correlation Summary
| Measurement | Immigrants from Philippines | Immigrants from Eritrea |
| Minimum | 6.0% | 3.2% |
| Maximum | 50.4% | 64.8% |
| Range | 44.4% | 61.6% |
| Mean | 30.0% | 36.7% |
| Median | 31.9% | 39.0% |
| Interquartile 25% (IQ1) | 22.8% | 31.5% |
| Interquartile 75% (IQ3) | 36.2% | 45.4% |
| Interquartile Range (IQR) | 13.4% | 13.9% |
| Standard Deviation (Sample) | 9.6% | 14.2% |
| Standard Deviation (Population) | 9.5% | 14.1% |
Similar Demographics by Bachelor's Degree
Demographics Similar to Immigrants from Philippines by Bachelor's Degree
In terms of bachelor's degree, the demographic groups most similar to Immigrants from Philippines are Scotch-Irish (36.4%, a difference of 0.080%), French (36.5%, a difference of 0.13%), Panamanian (36.5%, a difference of 0.16%), Immigrants from Thailand (36.5%, a difference of 0.26%), and Immigrants from Middle Africa (36.6%, a difference of 0.45%).
| Demographics | Rating | Rank | Bachelor's Degree |
| Finns | 22.2 /100 | #205 | Fair 36.7% |
| Spaniards | 21.2 /100 | #206 | Fair 36.6% |
| Immigrants | Middle Africa | 20.6 /100 | #207 | Fair 36.6% |
| Immigrants | Thailand | 19.4 /100 | #208 | Poor 36.5% |
| Panamanians | 18.8 /100 | #209 | Poor 36.5% |
| French | 18.6 /100 | #210 | Poor 36.5% |
| Scotch-Irish | 18.3 /100 | #211 | Poor 36.4% |
| Immigrants | Philippines | 17.8 /100 | #212 | Poor 36.4% |
| Immigrants | Panama | 14.2 /100 | #213 | Poor 36.2% |
| Germans | 13.9 /100 | #214 | Poor 36.1% |
| Immigrants | Western Africa | 13.8 /100 | #215 | Poor 36.1% |
| Barbadians | 13.5 /100 | #216 | Poor 36.1% |
| German Russians | 10.2 /100 | #217 | Poor 35.8% |
| Sub-Saharan Africans | 9.8 /100 | #218 | Tragic 35.8% |
| West Indians | 9.7 /100 | #219 | Tragic 35.8% |
Demographics Similar to Immigrants from Eritrea by Bachelor's Degree
In terms of bachelor's degree, the demographic groups most similar to Immigrants from Eritrea are Lebanese (40.4%, a difference of 0.0%), Immigrants from Albania (40.4%, a difference of 0.020%), British (40.4%, a difference of 0.030%), Immigrants from Eastern Africa (40.4%, a difference of 0.080%), and Moroccan (40.5%, a difference of 0.12%).
| Demographics | Rating | Rank | Bachelor's Degree |
| Austrians | 95.5 /100 | #117 | Exceptional 40.6% |
| Croatians | 95.5 /100 | #118 | Exceptional 40.6% |
| Immigrants | Syria | 94.9 /100 | #119 | Exceptional 40.5% |
| Venezuelans | 94.7 /100 | #120 | Exceptional 40.5% |
| Moroccans | 94.6 /100 | #121 | Exceptional 40.5% |
| Immigrants | Albania | 94.4 /100 | #122 | Exceptional 40.4% |
| Lebanese | 94.3 /100 | #123 | Exceptional 40.4% |
| Immigrants | Eritrea | 94.3 /100 | #124 | Exceptional 40.4% |
| British | 94.2 /100 | #125 | Exceptional 40.4% |
| Immigrants | Eastern Africa | 94.1 /100 | #126 | Exceptional 40.4% |
| Immigrants | Jordan | 93.4 /100 | #127 | Exceptional 40.3% |
| Immigrants | Venezuela | 92.9 /100 | #128 | Exceptional 40.2% |
| Serbians | 92.4 /100 | #129 | Exceptional 40.1% |
| Sierra Leoneans | 92.2 /100 | #130 | Exceptional 40.1% |
| Italians | 91.9 /100 | #131 | Exceptional 40.1% |