Colville vs Immigrants from Eritrea Bachelor's Degree
COMPARE
Colville
Immigrants from Eritrea
Bachelor's Degree
Bachelor's Degree Comparison
Colville
Immigrants from Eritrea
29.0%
BACHELOR'S DEGREE
0.0/ 100
METRIC RATING
317th/ 347
METRIC RANK
40.4%
BACHELOR'S DEGREE
94.3/ 100
METRIC RATING
124th/ 347
METRIC RANK
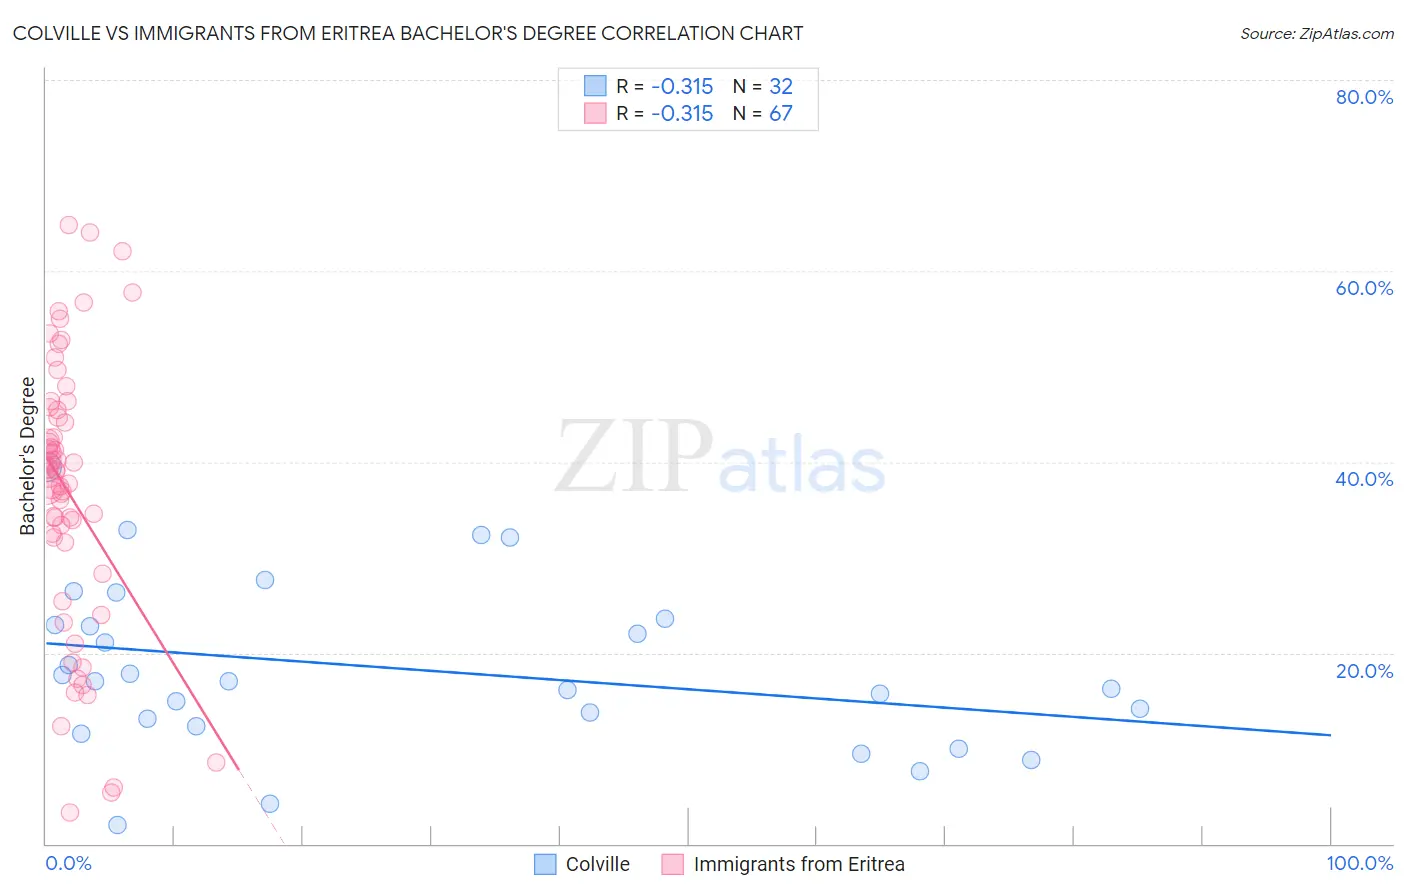
Colville vs Immigrants from Eritrea Bachelor's Degree Correlation Chart
The statistical analysis conducted on geographies consisting of 34,683,925 people shows a mild negative correlation between the proportion of Colville and percentage of population with at least bachelor's degree education in the United States with a correlation coefficient (R) of -0.315 and weighted average of 29.0%. Similarly, the statistical analysis conducted on geographies consisting of 104,855,166 people shows a mild negative correlation between the proportion of Immigrants from Eritrea and percentage of population with at least bachelor's degree education in the United States with a correlation coefficient (R) of -0.315 and weighted average of 40.4%, a difference of 39.3%.
Bachelor's Degree Correlation Summary
| Measurement | Colville | Immigrants from Eritrea |
| Minimum | 1.9% | 3.2% |
| Maximum | 39.5% | 64.8% |
| Range | 37.5% | 61.6% |
| Mean | 18.3% | 36.7% |
| Median | 17.0% | 39.0% |
| Interquartile 25% (IQ1) | 12.7% | 31.5% |
| Interquartile 75% (IQ3) | 23.2% | 45.4% |
| Interquartile Range (IQR) | 10.6% | 13.9% |
| Standard Deviation (Sample) | 8.7% | 14.2% |
| Standard Deviation (Population) | 8.6% | 14.1% |
Similar Demographics by Bachelor's Degree
Demographics Similar to Colville by Bachelor's Degree
In terms of bachelor's degree, the demographic groups most similar to Colville are Yaqui (29.0%, a difference of 0.050%), Sioux (29.1%, a difference of 0.20%), Creek (28.9%, a difference of 0.50%), Kiowa (28.8%, a difference of 0.55%), and Alaskan Athabascan (28.8%, a difference of 0.63%).
| Demographics | Rating | Rank | Bachelor's Degree |
| Cheyenne | 0.0 /100 | #310 | Tragic 29.4% |
| Choctaw | 0.0 /100 | #311 | Tragic 29.4% |
| Seminole | 0.0 /100 | #312 | Tragic 29.4% |
| Alaska Natives | 0.0 /100 | #313 | Tragic 29.4% |
| Shoshone | 0.0 /100 | #314 | Tragic 29.3% |
| Immigrants | Cabo Verde | 0.0 /100 | #315 | Tragic 29.2% |
| Sioux | 0.0 /100 | #316 | Tragic 29.1% |
| Colville | 0.0 /100 | #317 | Tragic 29.0% |
| Yaqui | 0.0 /100 | #318 | Tragic 29.0% |
| Creek | 0.0 /100 | #319 | Tragic 28.9% |
| Kiowa | 0.0 /100 | #320 | Tragic 28.8% |
| Alaskan Athabascans | 0.0 /100 | #321 | Tragic 28.8% |
| Tsimshian | 0.0 /100 | #322 | Tragic 28.8% |
| Fijians | 0.0 /100 | #323 | Tragic 28.7% |
| Dutch West Indians | 0.0 /100 | #324 | Tragic 28.5% |
Demographics Similar to Immigrants from Eritrea by Bachelor's Degree
In terms of bachelor's degree, the demographic groups most similar to Immigrants from Eritrea are Lebanese (40.4%, a difference of 0.0%), Immigrants from Albania (40.4%, a difference of 0.020%), British (40.4%, a difference of 0.030%), Immigrants from Eastern Africa (40.4%, a difference of 0.080%), and Moroccan (40.5%, a difference of 0.12%).
| Demographics | Rating | Rank | Bachelor's Degree |
| Austrians | 95.5 /100 | #117 | Exceptional 40.6% |
| Croatians | 95.5 /100 | #118 | Exceptional 40.6% |
| Immigrants | Syria | 94.9 /100 | #119 | Exceptional 40.5% |
| Venezuelans | 94.7 /100 | #120 | Exceptional 40.5% |
| Moroccans | 94.6 /100 | #121 | Exceptional 40.5% |
| Immigrants | Albania | 94.4 /100 | #122 | Exceptional 40.4% |
| Lebanese | 94.3 /100 | #123 | Exceptional 40.4% |
| Immigrants | Eritrea | 94.3 /100 | #124 | Exceptional 40.4% |
| British | 94.2 /100 | #125 | Exceptional 40.4% |
| Immigrants | Eastern Africa | 94.1 /100 | #126 | Exceptional 40.4% |
| Immigrants | Jordan | 93.4 /100 | #127 | Exceptional 40.3% |
| Immigrants | Venezuela | 92.9 /100 | #128 | Exceptional 40.2% |
| Serbians | 92.4 /100 | #129 | Exceptional 40.1% |
| Sierra Leoneans | 92.2 /100 | #130 | Exceptional 40.1% |
| Italians | 91.9 /100 | #131 | Exceptional 40.1% |