Belgian vs Immigrants from Eritrea Bachelor's Degree
COMPARE
Belgian
Immigrants from Eritrea
Bachelor's Degree
Bachelor's Degree Comparison
Belgians
Immigrants from Eritrea
37.0%
BACHELOR'S DEGREE
29.9/ 100
METRIC RATING
194th/ 347
METRIC RANK
40.4%
BACHELOR'S DEGREE
94.3/ 100
METRIC RATING
124th/ 347
METRIC RANK
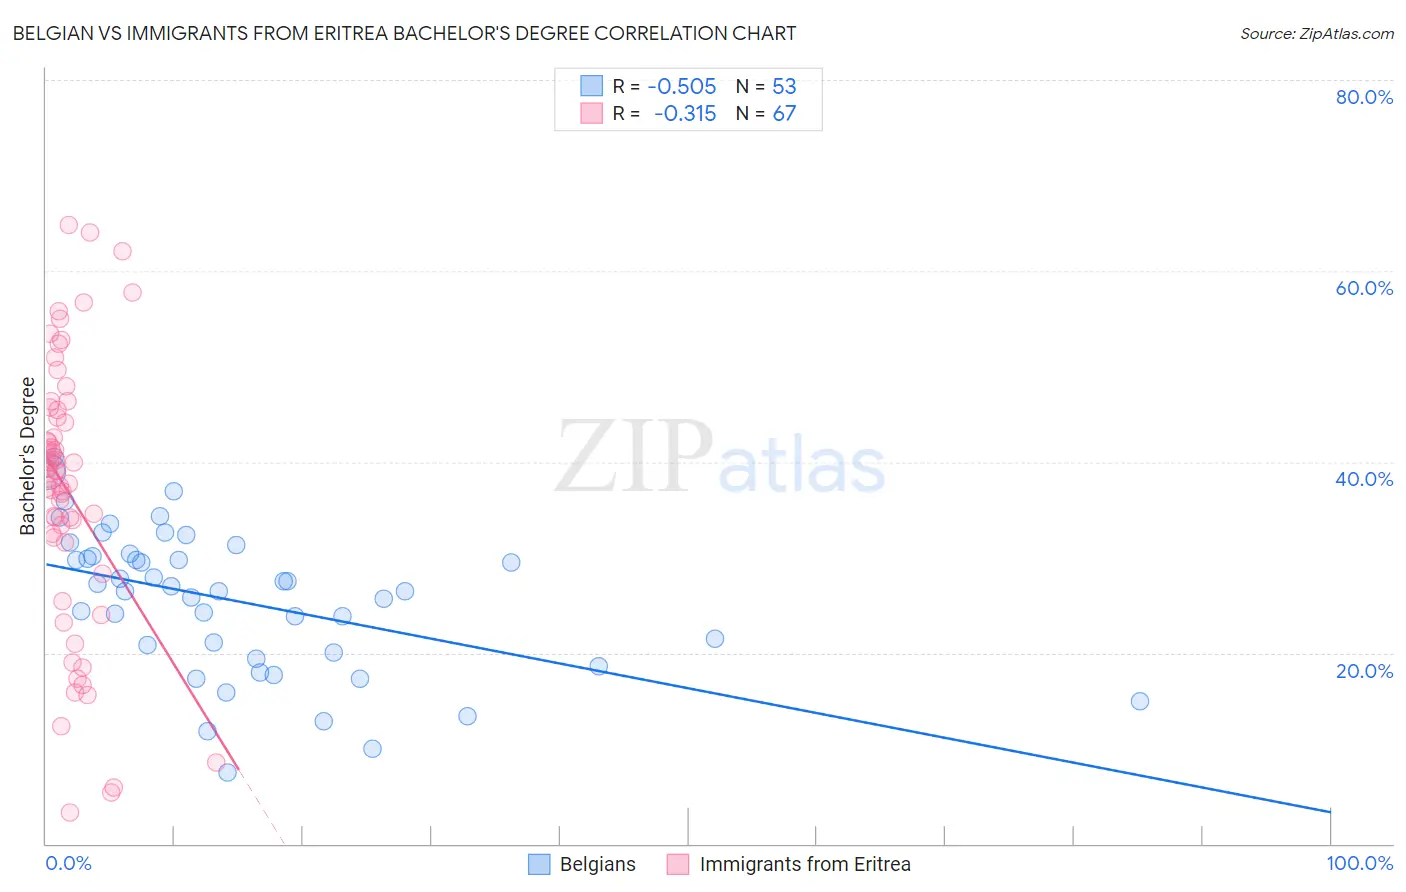
Belgian vs Immigrants from Eritrea Bachelor's Degree Correlation Chart
The statistical analysis conducted on geographies consisting of 356,003,324 people shows a substantial negative correlation between the proportion of Belgians and percentage of population with at least bachelor's degree education in the United States with a correlation coefficient (R) of -0.505 and weighted average of 37.0%. Similarly, the statistical analysis conducted on geographies consisting of 104,855,166 people shows a mild negative correlation between the proportion of Immigrants from Eritrea and percentage of population with at least bachelor's degree education in the United States with a correlation coefficient (R) of -0.315 and weighted average of 40.4%, a difference of 9.1%.
Bachelor's Degree Correlation Summary
| Measurement | Belgian | Immigrants from Eritrea |
| Minimum | 7.4% | 3.2% |
| Maximum | 40.5% | 64.8% |
| Range | 33.1% | 61.6% |
| Mean | 25.4% | 36.7% |
| Median | 26.4% | 39.0% |
| Interquartile 25% (IQ1) | 19.7% | 31.5% |
| Interquartile 75% (IQ3) | 30.2% | 45.4% |
| Interquartile Range (IQR) | 10.5% | 13.9% |
| Standard Deviation (Sample) | 7.5% | 14.2% |
| Standard Deviation (Population) | 7.5% | 14.1% |
Similar Demographics by Bachelor's Degree
Demographics Similar to Belgians by Bachelor's Degree
In terms of bachelor's degree, the demographic groups most similar to Belgians are Korean (37.0%, a difference of 0.010%), Celtic (37.0%, a difference of 0.040%), Czechoslovakian (37.0%, a difference of 0.090%), Welsh (37.0%, a difference of 0.10%), and Yugoslavian (37.1%, a difference of 0.19%).
| Demographics | Rating | Rank | Bachelor's Degree |
| English | 39.7 /100 | #187 | Fair 37.4% |
| Immigrants | Oceania | 37.3 /100 | #188 | Fair 37.3% |
| Slovaks | 36.9 /100 | #189 | Fair 37.3% |
| Swiss | 34.1 /100 | #190 | Fair 37.2% |
| Nigerians | 33.9 /100 | #191 | Fair 37.2% |
| Immigrants | Vietnam | 32.1 /100 | #192 | Fair 37.1% |
| Yugoslavians | 31.5 /100 | #193 | Fair 37.1% |
| Belgians | 29.9 /100 | #194 | Fair 37.0% |
| Koreans | 29.8 /100 | #195 | Fair 37.0% |
| Celtics | 29.5 /100 | #196 | Fair 37.0% |
| Czechoslovakians | 29.2 /100 | #197 | Fair 37.0% |
| Welsh | 29.1 /100 | #198 | Fair 37.0% |
| Immigrants | Costa Rica | 27.4 /100 | #199 | Fair 36.9% |
| Immigrants | Ghana | 27.4 /100 | #200 | Fair 36.9% |
| Immigrants | South Eastern Asia | 25.4 /100 | #201 | Fair 36.8% |
Demographics Similar to Immigrants from Eritrea by Bachelor's Degree
In terms of bachelor's degree, the demographic groups most similar to Immigrants from Eritrea are Lebanese (40.4%, a difference of 0.0%), Immigrants from Albania (40.4%, a difference of 0.020%), British (40.4%, a difference of 0.030%), Immigrants from Eastern Africa (40.4%, a difference of 0.080%), and Moroccan (40.5%, a difference of 0.12%).
| Demographics | Rating | Rank | Bachelor's Degree |
| Austrians | 95.5 /100 | #117 | Exceptional 40.6% |
| Croatians | 95.5 /100 | #118 | Exceptional 40.6% |
| Immigrants | Syria | 94.9 /100 | #119 | Exceptional 40.5% |
| Venezuelans | 94.7 /100 | #120 | Exceptional 40.5% |
| Moroccans | 94.6 /100 | #121 | Exceptional 40.5% |
| Immigrants | Albania | 94.4 /100 | #122 | Exceptional 40.4% |
| Lebanese | 94.3 /100 | #123 | Exceptional 40.4% |
| Immigrants | Eritrea | 94.3 /100 | #124 | Exceptional 40.4% |
| British | 94.2 /100 | #125 | Exceptional 40.4% |
| Immigrants | Eastern Africa | 94.1 /100 | #126 | Exceptional 40.4% |
| Immigrants | Jordan | 93.4 /100 | #127 | Exceptional 40.3% |
| Immigrants | Venezuela | 92.9 /100 | #128 | Exceptional 40.2% |
| Serbians | 92.4 /100 | #129 | Exceptional 40.1% |
| Sierra Leoneans | 92.2 /100 | #130 | Exceptional 40.1% |
| Italians | 91.9 /100 | #131 | Exceptional 40.1% |