Cree vs Alsatian Bachelor's Degree
COMPARE
Cree
Alsatian
Bachelor's Degree
Bachelor's Degree Comparison
Cree
Alsatians
33.6%
BACHELOR'S DEGREE
1.0/ 100
METRIC RATING
248th/ 347
METRIC RANK
41.0%
BACHELOR'S DEGREE
97.0/ 100
METRIC RATING
106th/ 347
METRIC RANK
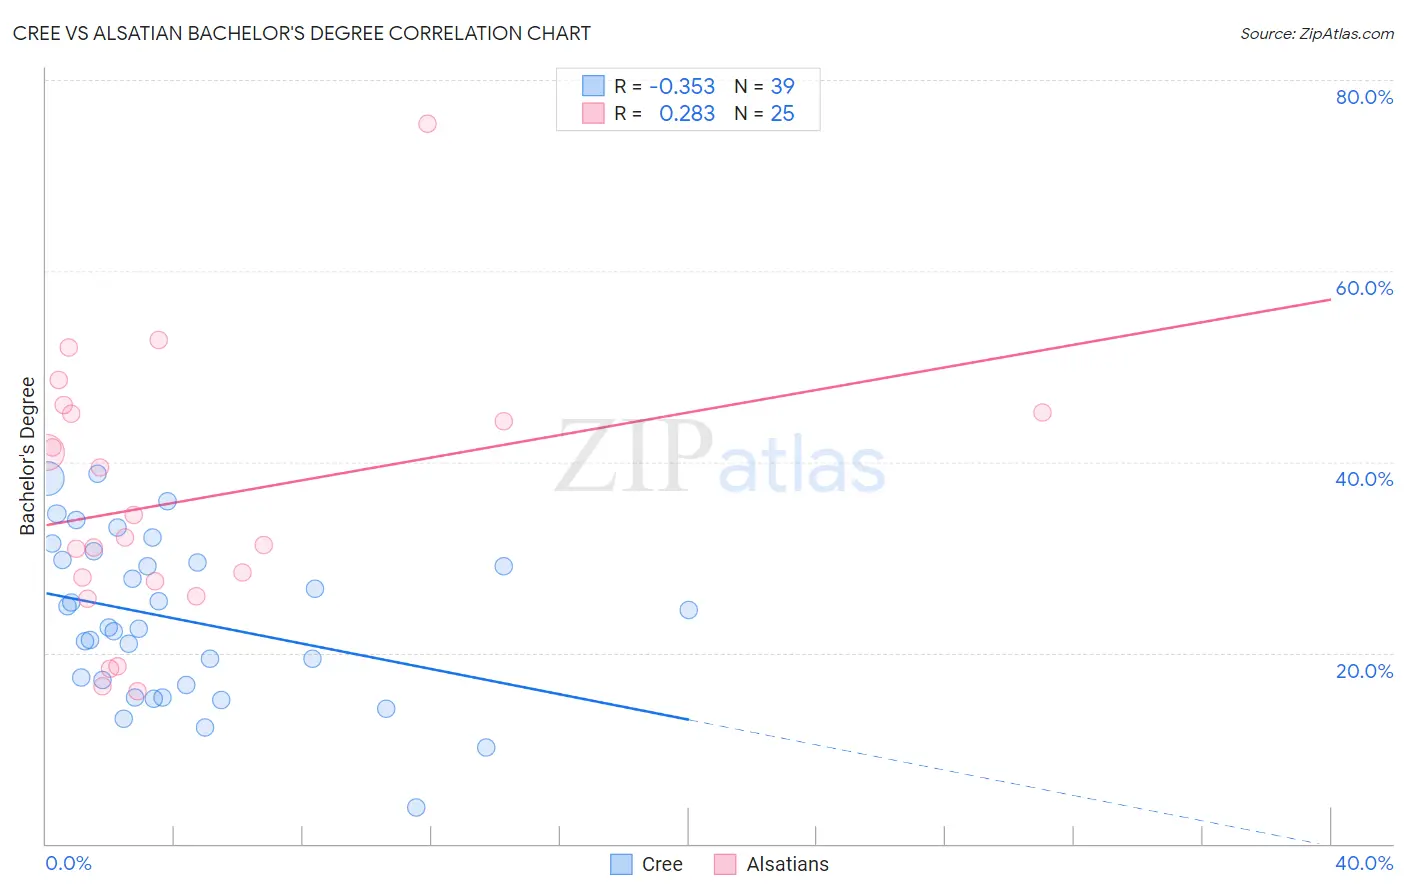
Cree vs Alsatian Bachelor's Degree Correlation Chart
The statistical analysis conducted on geographies consisting of 76,210,625 people shows a mild negative correlation between the proportion of Cree and percentage of population with at least bachelor's degree education in the United States with a correlation coefficient (R) of -0.353 and weighted average of 33.6%. Similarly, the statistical analysis conducted on geographies consisting of 82,682,365 people shows a weak positive correlation between the proportion of Alsatians and percentage of population with at least bachelor's degree education in the United States with a correlation coefficient (R) of 0.283 and weighted average of 41.0%, a difference of 22.2%.
Bachelor's Degree Correlation Summary
| Measurement | Cree | Alsatian |
| Minimum | 3.8% | 16.0% |
| Maximum | 38.7% | 75.4% |
| Range | 34.9% | 59.4% |
| Mean | 23.5% | 35.8% |
| Median | 22.6% | 32.1% |
| Interquartile 25% (IQ1) | 16.6% | 26.7% |
| Interquartile 75% (IQ3) | 29.7% | 45.1% |
| Interquartile Range (IQR) | 13.1% | 18.4% |
| Standard Deviation (Sample) | 8.3% | 13.8% |
| Standard Deviation (Population) | 8.2% | 13.5% |
Similar Demographics by Bachelor's Degree
Demographics Similar to Cree by Bachelor's Degree
In terms of bachelor's degree, the demographic groups most similar to Cree are Immigrants from Congo (33.6%, a difference of 0.010%), Jamaican (33.6%, a difference of 0.10%), Immigrants from Liberia (33.5%, a difference of 0.13%), Indonesian (33.5%, a difference of 0.13%), and Immigrants from Fiji (33.7%, a difference of 0.47%).
| Demographics | Rating | Rank | Bachelor's Degree |
| Immigrants | Cambodia | 1.9 /100 | #241 | Tragic 34.2% |
| Immigrants | Nonimmigrants | 1.8 /100 | #242 | Tragic 34.2% |
| Immigrants | Guyana | 1.4 /100 | #243 | Tragic 33.9% |
| Delaware | 1.2 /100 | #244 | Tragic 33.8% |
| Immigrants | Fiji | 1.2 /100 | #245 | Tragic 33.7% |
| Jamaicans | 1.0 /100 | #246 | Tragic 33.6% |
| Immigrants | Congo | 1.0 /100 | #247 | Tragic 33.6% |
| Cree | 1.0 /100 | #248 | Tragic 33.6% |
| Immigrants | Liberia | 0.9 /100 | #249 | Tragic 33.5% |
| Indonesians | 0.9 /100 | #250 | Tragic 33.5% |
| Japanese | 0.7 /100 | #251 | Tragic 33.3% |
| Immigrants | Bahamas | 0.7 /100 | #252 | Tragic 33.3% |
| U.S. Virgin Islanders | 0.7 /100 | #253 | Tragic 33.2% |
| Native Hawaiians | 0.7 /100 | #254 | Tragic 33.2% |
| Iroquois | 0.7 /100 | #255 | Tragic 33.2% |
Demographics Similar to Alsatians by Bachelor's Degree
In terms of bachelor's degree, the demographic groups most similar to Alsatians are Northern European (41.0%, a difference of 0.17%), Syrian (41.1%, a difference of 0.26%), Jordanian (41.2%, a difference of 0.29%), Ukrainian (40.9%, a difference of 0.31%), and Arab (40.9%, a difference of 0.33%).
| Demographics | Rating | Rank | Bachelor's Degree |
| Immigrants | England | 98.1 /100 | #99 | Exceptional 41.4% |
| Macedonians | 98.1 /100 | #100 | Exceptional 41.4% |
| Immigrants | Morocco | 98.0 /100 | #101 | Exceptional 41.4% |
| Immigrants | Italy | 97.8 /100 | #102 | Exceptional 41.3% |
| Chileans | 97.5 /100 | #103 | Exceptional 41.2% |
| Jordanians | 97.4 /100 | #104 | Exceptional 41.2% |
| Syrians | 97.4 /100 | #105 | Exceptional 41.1% |
| Alsatians | 97.0 /100 | #106 | Exceptional 41.0% |
| Northern Europeans | 96.8 /100 | #107 | Exceptional 41.0% |
| Ukrainians | 96.6 /100 | #108 | Exceptional 40.9% |
| Arabs | 96.6 /100 | #109 | Exceptional 40.9% |
| Albanians | 96.5 /100 | #110 | Exceptional 40.9% |
| Immigrants | Chile | 96.4 /100 | #111 | Exceptional 40.8% |
| Ugandans | 96.3 /100 | #112 | Exceptional 40.8% |
| Brazilians | 96.3 /100 | #113 | Exceptional 40.8% |