Immigrants from Greece vs Alsatian Bachelor's Degree
COMPARE
Immigrants from Greece
Alsatian
Bachelor's Degree
Bachelor's Degree Comparison
Immigrants from Greece
Alsatians
44.5%
BACHELOR'S DEGREE
99.9/ 100
METRIC RATING
50th/ 347
METRIC RANK
41.0%
BACHELOR'S DEGREE
97.0/ 100
METRIC RATING
106th/ 347
METRIC RANK
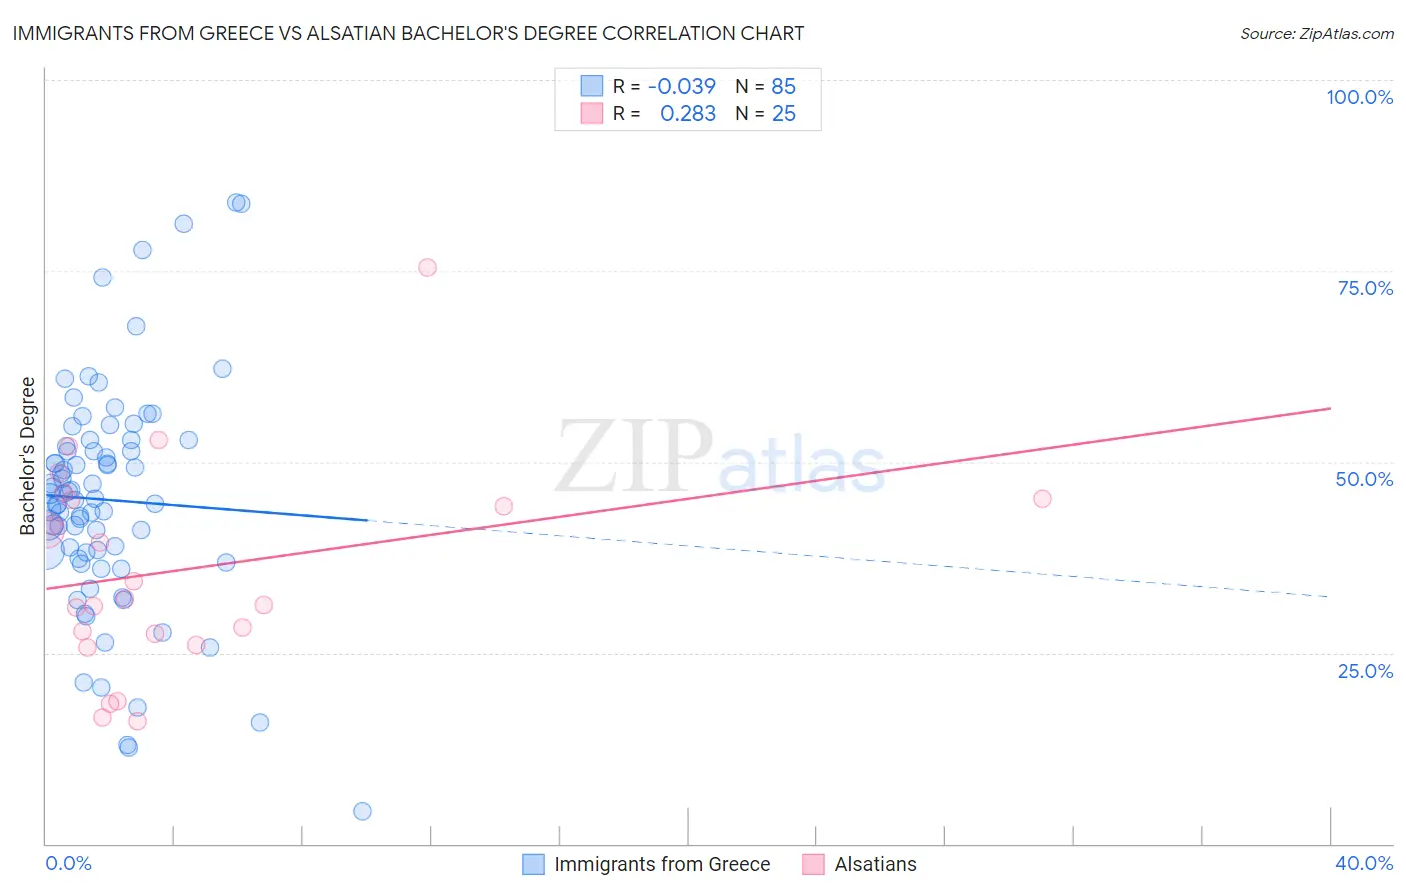
Immigrants from Greece vs Alsatian Bachelor's Degree Correlation Chart
The statistical analysis conducted on geographies consisting of 216,876,242 people shows no correlation between the proportion of Immigrants from Greece and percentage of population with at least bachelor's degree education in the United States with a correlation coefficient (R) of -0.039 and weighted average of 44.5%. Similarly, the statistical analysis conducted on geographies consisting of 82,682,365 people shows a weak positive correlation between the proportion of Alsatians and percentage of population with at least bachelor's degree education in the United States with a correlation coefficient (R) of 0.283 and weighted average of 41.0%, a difference of 8.3%.
Bachelor's Degree Correlation Summary
| Measurement | Immigrants from Greece | Alsatian |
| Minimum | 4.3% | 16.0% |
| Maximum | 83.9% | 75.4% |
| Range | 79.6% | 59.4% |
| Mean | 45.0% | 35.8% |
| Median | 45.2% | 32.1% |
| Interquartile 25% (IQ1) | 37.8% | 26.7% |
| Interquartile 75% (IQ3) | 52.4% | 45.1% |
| Interquartile Range (IQR) | 14.6% | 18.4% |
| Standard Deviation (Sample) | 14.9% | 13.8% |
| Standard Deviation (Population) | 14.8% | 13.5% |
Similar Demographics by Bachelor's Degree
Demographics Similar to Immigrants from Greece by Bachelor's Degree
In terms of bachelor's degree, the demographic groups most similar to Immigrants from Greece are Immigrants from Norway (44.5%, a difference of 0.12%), Asian (44.4%, a difference of 0.14%), Bolivian (44.6%, a difference of 0.24%), Estonian (44.6%, a difference of 0.24%), and Immigrants from Bulgaria (44.6%, a difference of 0.28%).
| Demographics | Rating | Rank | Bachelor's Degree |
| Immigrants | South Africa | 99.9 /100 | #43 | Exceptional 44.8% |
| Immigrants | Lithuania | 99.9 /100 | #44 | Exceptional 44.6% |
| Immigrants | Kuwait | 99.9 /100 | #45 | Exceptional 44.6% |
| Immigrants | Bulgaria | 99.9 /100 | #46 | Exceptional 44.6% |
| Bolivians | 99.9 /100 | #47 | Exceptional 44.6% |
| Estonians | 99.9 /100 | #48 | Exceptional 44.6% |
| Immigrants | Norway | 99.9 /100 | #49 | Exceptional 44.5% |
| Immigrants | Greece | 99.9 /100 | #50 | Exceptional 44.5% |
| Asians | 99.9 /100 | #51 | Exceptional 44.4% |
| Immigrants | Spain | 99.9 /100 | #52 | Exceptional 44.3% |
| Immigrants | Asia | 99.9 /100 | #53 | Exceptional 44.3% |
| Immigrants | Austria | 99.9 /100 | #54 | Exceptional 44.2% |
| Immigrants | Bolivia | 99.9 /100 | #55 | Exceptional 44.2% |
| Immigrants | Serbia | 99.9 /100 | #56 | Exceptional 44.1% |
| Paraguayans | 99.9 /100 | #57 | Exceptional 44.0% |
Demographics Similar to Alsatians by Bachelor's Degree
In terms of bachelor's degree, the demographic groups most similar to Alsatians are Northern European (41.0%, a difference of 0.17%), Syrian (41.1%, a difference of 0.26%), Jordanian (41.2%, a difference of 0.29%), Ukrainian (40.9%, a difference of 0.31%), and Arab (40.9%, a difference of 0.33%).
| Demographics | Rating | Rank | Bachelor's Degree |
| Immigrants | England | 98.1 /100 | #99 | Exceptional 41.4% |
| Macedonians | 98.1 /100 | #100 | Exceptional 41.4% |
| Immigrants | Morocco | 98.0 /100 | #101 | Exceptional 41.4% |
| Immigrants | Italy | 97.8 /100 | #102 | Exceptional 41.3% |
| Chileans | 97.5 /100 | #103 | Exceptional 41.2% |
| Jordanians | 97.4 /100 | #104 | Exceptional 41.2% |
| Syrians | 97.4 /100 | #105 | Exceptional 41.1% |
| Alsatians | 97.0 /100 | #106 | Exceptional 41.0% |
| Northern Europeans | 96.8 /100 | #107 | Exceptional 41.0% |
| Ukrainians | 96.6 /100 | #108 | Exceptional 40.9% |
| Arabs | 96.6 /100 | #109 | Exceptional 40.9% |
| Albanians | 96.5 /100 | #110 | Exceptional 40.9% |
| Immigrants | Chile | 96.4 /100 | #111 | Exceptional 40.8% |
| Ugandans | 96.3 /100 | #112 | Exceptional 40.8% |
| Brazilians | 96.3 /100 | #113 | Exceptional 40.8% |