Immigrants from Oceania vs Alsatian Bachelor's Degree
COMPARE
Immigrants from Oceania
Alsatian
Bachelor's Degree
Bachelor's Degree Comparison
Immigrants from Oceania
Alsatians
37.3%
BACHELOR'S DEGREE
37.3/ 100
METRIC RATING
188th/ 347
METRIC RANK
41.0%
BACHELOR'S DEGREE
97.0/ 100
METRIC RATING
106th/ 347
METRIC RANK
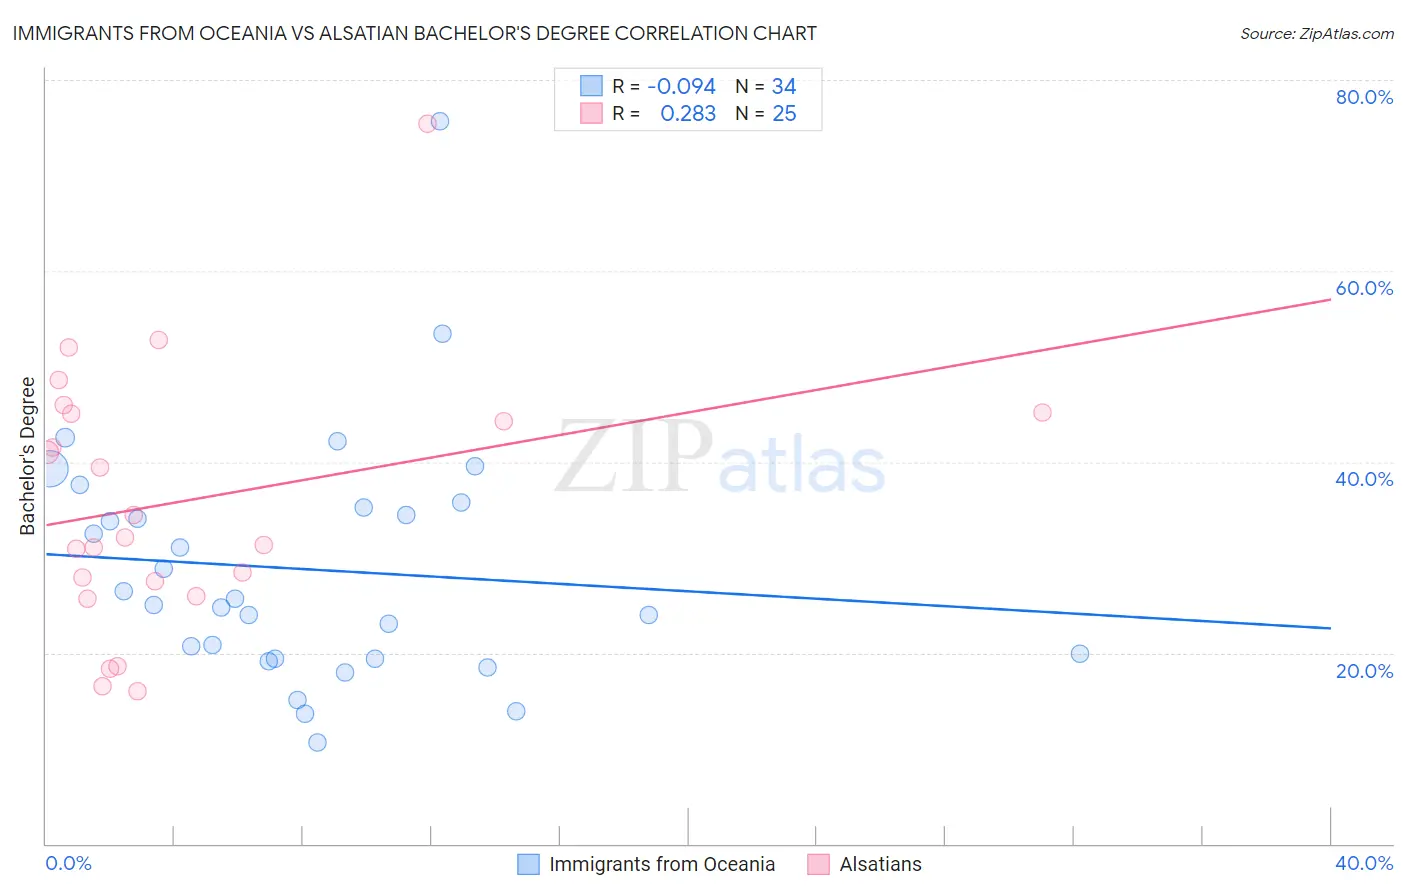
Immigrants from Oceania vs Alsatian Bachelor's Degree Correlation Chart
The statistical analysis conducted on geographies consisting of 305,508,659 people shows a slight negative correlation between the proportion of Immigrants from Oceania and percentage of population with at least bachelor's degree education in the United States with a correlation coefficient (R) of -0.094 and weighted average of 37.3%. Similarly, the statistical analysis conducted on geographies consisting of 82,682,365 people shows a weak positive correlation between the proportion of Alsatians and percentage of population with at least bachelor's degree education in the United States with a correlation coefficient (R) of 0.283 and weighted average of 41.0%, a difference of 9.9%.
Bachelor's Degree Correlation Summary
| Measurement | Immigrants from Oceania | Alsatian |
| Minimum | 10.7% | 16.0% |
| Maximum | 75.7% | 75.4% |
| Range | 65.0% | 59.4% |
| Mean | 28.7% | 35.8% |
| Median | 25.4% | 32.1% |
| Interquartile 25% (IQ1) | 19.4% | 26.7% |
| Interquartile 75% (IQ3) | 35.2% | 45.1% |
| Interquartile Range (IQR) | 15.8% | 18.4% |
| Standard Deviation (Sample) | 12.9% | 13.8% |
| Standard Deviation (Population) | 12.7% | 13.5% |
Similar Demographics by Bachelor's Degree
Demographics Similar to Immigrants from Oceania by Bachelor's Degree
In terms of bachelor's degree, the demographic groups most similar to Immigrants from Oceania are Slovak (37.3%, a difference of 0.050%), English (37.4%, a difference of 0.24%), Norwegian (37.5%, a difference of 0.32%), Swiss (37.2%, a difference of 0.35%), and Nigerian (37.2%, a difference of 0.37%).
| Demographics | Rating | Rank | Bachelor's Degree |
| Immigrants | Senegal | 43.8 /100 | #181 | Average 37.6% |
| Immigrants | Bosnia and Herzegovina | 43.4 /100 | #182 | Average 37.6% |
| Senegalese | 42.2 /100 | #183 | Average 37.5% |
| Scandinavians | 41.7 /100 | #184 | Average 37.5% |
| Immigrants | Peru | 41.3 /100 | #185 | Average 37.5% |
| Norwegians | 40.4 /100 | #186 | Average 37.5% |
| English | 39.7 /100 | #187 | Fair 37.4% |
| Immigrants | Oceania | 37.3 /100 | #188 | Fair 37.3% |
| Slovaks | 36.9 /100 | #189 | Fair 37.3% |
| Swiss | 34.1 /100 | #190 | Fair 37.2% |
| Nigerians | 33.9 /100 | #191 | Fair 37.2% |
| Immigrants | Vietnam | 32.1 /100 | #192 | Fair 37.1% |
| Yugoslavians | 31.5 /100 | #193 | Fair 37.1% |
| Belgians | 29.9 /100 | #194 | Fair 37.0% |
| Koreans | 29.8 /100 | #195 | Fair 37.0% |
Demographics Similar to Alsatians by Bachelor's Degree
In terms of bachelor's degree, the demographic groups most similar to Alsatians are Northern European (41.0%, a difference of 0.17%), Syrian (41.1%, a difference of 0.26%), Jordanian (41.2%, a difference of 0.29%), Ukrainian (40.9%, a difference of 0.31%), and Arab (40.9%, a difference of 0.33%).
| Demographics | Rating | Rank | Bachelor's Degree |
| Immigrants | England | 98.1 /100 | #99 | Exceptional 41.4% |
| Macedonians | 98.1 /100 | #100 | Exceptional 41.4% |
| Immigrants | Morocco | 98.0 /100 | #101 | Exceptional 41.4% |
| Immigrants | Italy | 97.8 /100 | #102 | Exceptional 41.3% |
| Chileans | 97.5 /100 | #103 | Exceptional 41.2% |
| Jordanians | 97.4 /100 | #104 | Exceptional 41.2% |
| Syrians | 97.4 /100 | #105 | Exceptional 41.1% |
| Alsatians | 97.0 /100 | #106 | Exceptional 41.0% |
| Northern Europeans | 96.8 /100 | #107 | Exceptional 41.0% |
| Ukrainians | 96.6 /100 | #108 | Exceptional 40.9% |
| Arabs | 96.6 /100 | #109 | Exceptional 40.9% |
| Albanians | 96.5 /100 | #110 | Exceptional 40.9% |
| Immigrants | Chile | 96.4 /100 | #111 | Exceptional 40.8% |
| Ugandans | 96.3 /100 | #112 | Exceptional 40.8% |
| Brazilians | 96.3 /100 | #113 | Exceptional 40.8% |