Iranian vs Alsatian In Labor Force | Age 20-24
COMPARE
Iranian
Alsatian
In Labor Force | Age 20-24
In Labor Force | Age 20-24 Comparison
Iranians
Alsatians
72.6%
IN LABOR FORCE | AGE 20-24
0.0/ 100
METRIC RATING
299th/ 347
METRIC RANK
74.8%
IN LABOR FORCE | AGE 20-24
27.1/ 100
METRIC RATING
193rd/ 347
METRIC RANK
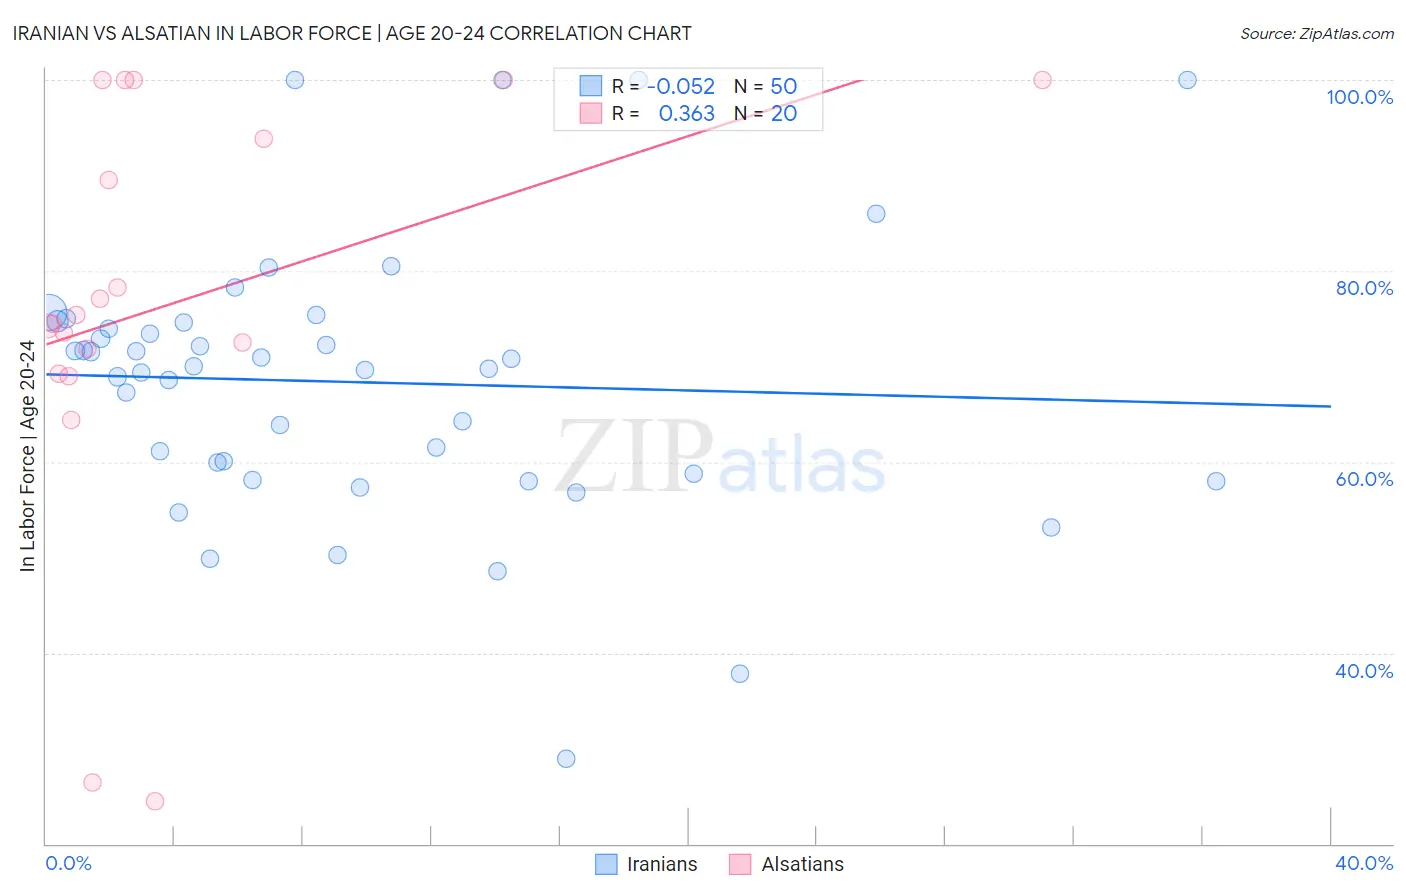
Iranian vs Alsatian In Labor Force | Age 20-24 Correlation Chart
The statistical analysis conducted on geographies consisting of 316,816,770 people shows a slight negative correlation between the proportion of Iranians and labor force participation rate among population between the ages 20 and 24 in the United States with a correlation coefficient (R) of -0.052 and weighted average of 72.6%. Similarly, the statistical analysis conducted on geographies consisting of 82,637,215 people shows a mild positive correlation between the proportion of Alsatians and labor force participation rate among population between the ages 20 and 24 in the United States with a correlation coefficient (R) of 0.363 and weighted average of 74.8%, a difference of 3.1%.
In Labor Force | Age 20-24 Correlation Summary
| Measurement | Iranian | Alsatian |
| Minimum | 28.9% | 24.4% |
| Maximum | 100.0% | 100.0% |
| Range | 71.1% | 75.6% |
| Mean | 68.4% | 76.7% |
| Median | 69.9% | 74.9% |
| Interquartile 25% (IQ1) | 58.8% | 70.5% |
| Interquartile 75% (IQ3) | 74.6% | 97.0% |
| Interquartile Range (IQR) | 15.8% | 26.5% |
| Standard Deviation (Sample) | 14.3% | 21.5% |
| Standard Deviation (Population) | 14.2% | 20.9% |
Similar Demographics by In Labor Force | Age 20-24
Demographics Similar to Iranians by In Labor Force | Age 20-24
In terms of in labor force | age 20-24, the demographic groups most similar to Iranians are Armenian (72.5%, a difference of 0.020%), Israeli (72.6%, a difference of 0.040%), Cuban (72.5%, a difference of 0.090%), Central American Indian (72.7%, a difference of 0.17%), and Native/Alaskan (72.4%, a difference of 0.18%).
| Demographics | Rating | Rank | In Labor Force | Age 20-24 |
| Pueblo | 0.0 /100 | #292 | Tragic 72.9% |
| Immigrants | Belize | 0.0 /100 | #293 | Tragic 72.8% |
| Immigrants | Argentina | 0.0 /100 | #294 | Tragic 72.8% |
| Okinawans | 0.0 /100 | #295 | Tragic 72.7% |
| Jamaicans | 0.0 /100 | #296 | Tragic 72.7% |
| Central American Indians | 0.0 /100 | #297 | Tragic 72.7% |
| Israelis | 0.0 /100 | #298 | Tragic 72.6% |
| Iranians | 0.0 /100 | #299 | Tragic 72.6% |
| Armenians | 0.0 /100 | #300 | Tragic 72.5% |
| Cubans | 0.0 /100 | #301 | Tragic 72.5% |
| Natives/Alaskans | 0.0 /100 | #302 | Tragic 72.4% |
| Ecuadorians | 0.0 /100 | #303 | Tragic 72.4% |
| Immigrants | West Indies | 0.0 /100 | #304 | Tragic 72.4% |
| Immigrants | Singapore | 0.0 /100 | #305 | Tragic 72.4% |
| Immigrants | Jamaica | 0.0 /100 | #306 | Tragic 72.4% |
Demographics Similar to Alsatians by In Labor Force | Age 20-24
In terms of in labor force | age 20-24, the demographic groups most similar to Alsatians are Immigrants from Europe (74.8%, a difference of 0.010%), Senegalese (74.8%, a difference of 0.020%), Immigrants from Denmark (74.8%, a difference of 0.030%), Eastern European (74.8%, a difference of 0.030%), and Immigrants from Vietnam (74.7%, a difference of 0.040%).
| Demographics | Rating | Rank | In Labor Force | Age 20-24 |
| Immigrants | Eastern Europe | 33.8 /100 | #186 | Fair 74.9% |
| Immigrants | Honduras | 33.5 /100 | #187 | Fair 74.9% |
| Hondurans | 32.7 /100 | #188 | Fair 74.8% |
| Immigrants | Northern Europe | 32.6 /100 | #189 | Fair 74.8% |
| Russians | 32.2 /100 | #190 | Fair 74.8% |
| Senegalese | 28.1 /100 | #191 | Fair 74.8% |
| Immigrants | Europe | 27.5 /100 | #192 | Fair 74.8% |
| Alsatians | 27.1 /100 | #193 | Fair 74.8% |
| Immigrants | Denmark | 25.8 /100 | #194 | Fair 74.8% |
| Eastern Europeans | 25.4 /100 | #195 | Fair 74.8% |
| Immigrants | Vietnam | 25.1 /100 | #196 | Fair 74.7% |
| Panamanians | 25.0 /100 | #197 | Fair 74.7% |
| Immigrants | Nigeria | 24.2 /100 | #198 | Fair 74.7% |
| Taiwanese | 23.2 /100 | #199 | Fair 74.7% |
| Nigerians | 21.9 /100 | #200 | Fair 74.7% |