Immigrants from Zaire vs Choctaw College, Under 1 year
COMPARE
Immigrants from Zaire
Choctaw
College, Under 1 year
College, Under 1 year Comparison
Immigrants from Zaire
Choctaw
64.1%
COLLEGE, UNDER 1 YEAR
14.6/ 100
METRIC RATING
204th/ 347
METRIC RANK
59.3%
COLLEGE, UNDER 1 YEAR
0.0/ 100
METRIC RATING
289th/ 347
METRIC RANK
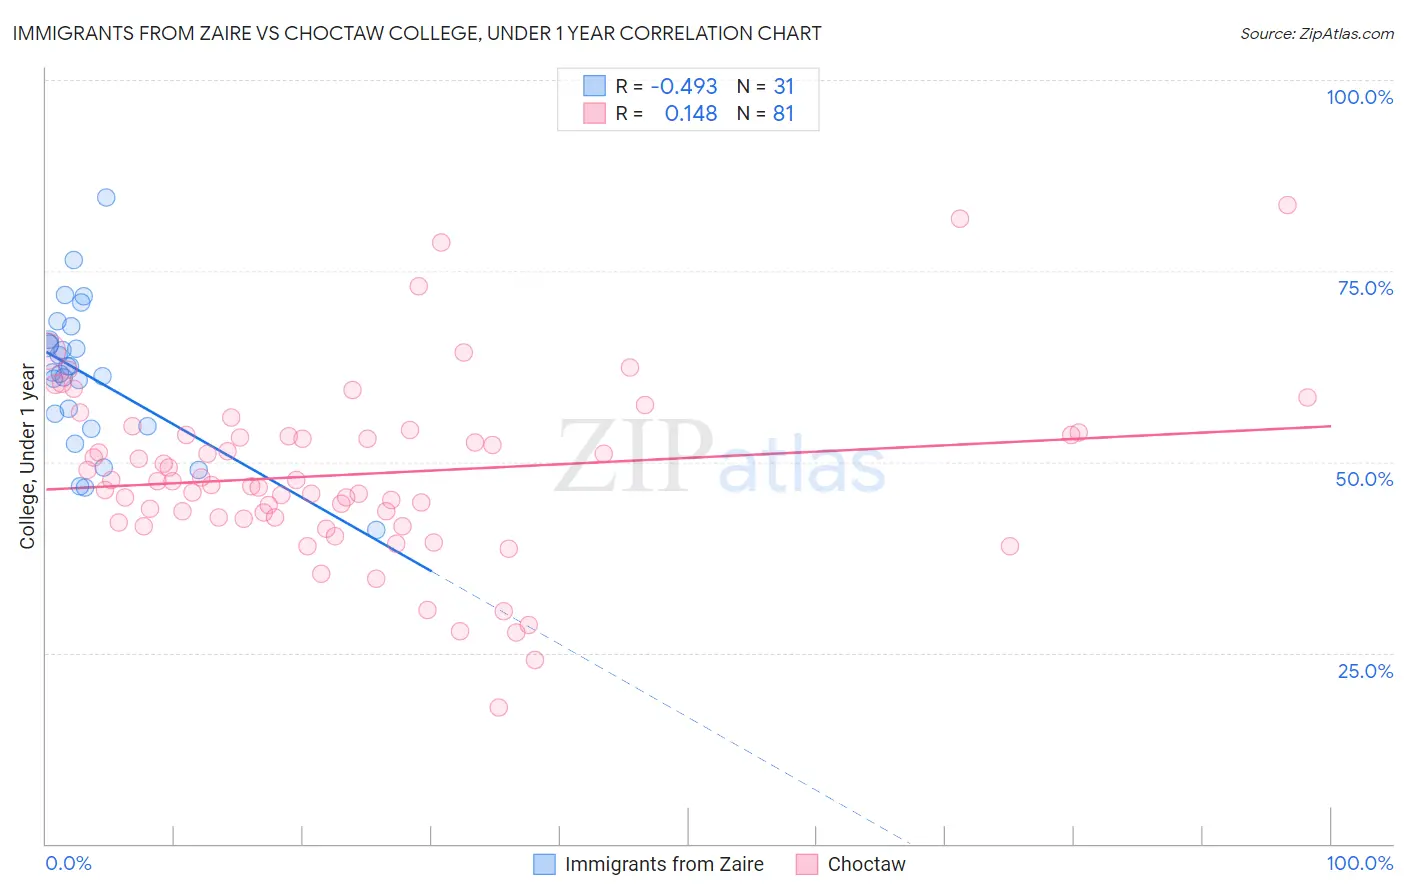
Immigrants from Zaire vs Choctaw College, Under 1 year Correlation Chart
The statistical analysis conducted on geographies consisting of 107,255,700 people shows a moderate negative correlation between the proportion of Immigrants from Zaire and percentage of population with at least college, under 1 year education in the United States with a correlation coefficient (R) of -0.493 and weighted average of 64.1%. Similarly, the statistical analysis conducted on geographies consisting of 269,741,683 people shows a poor positive correlation between the proportion of Choctaw and percentage of population with at least college, under 1 year education in the United States with a correlation coefficient (R) of 0.148 and weighted average of 59.3%, a difference of 8.1%.
College, Under 1 year Correlation Summary
| Measurement | Immigrants from Zaire | Choctaw |
| Minimum | 41.0% | 17.8% |
| Maximum | 84.6% | 83.7% |
| Range | 43.5% | 65.9% |
| Mean | 61.3% | 48.4% |
| Median | 61.7% | 47.4% |
| Interquartile 25% (IQ1) | 54.7% | 42.6% |
| Interquartile 75% (IQ3) | 66.0% | 53.5% |
| Interquartile Range (IQR) | 11.3% | 10.9% |
| Standard Deviation (Sample) | 9.3% | 11.6% |
| Standard Deviation (Population) | 9.2% | 11.5% |
Similar Demographics by College, Under 1 year
Demographics Similar to Immigrants from Zaire by College, Under 1 year
In terms of college, under 1 year, the demographic groups most similar to Immigrants from Zaire are Peruvian (64.1%, a difference of 0.080%), Uruguayan (64.2%, a difference of 0.090%), French Canadian (64.2%, a difference of 0.14%), South American (64.2%, a difference of 0.14%), and White/Caucasian (64.0%, a difference of 0.17%).
| Demographics | Rating | Rank | College, Under 1 year |
| Costa Ricans | 19.6 /100 | #197 | Poor 64.4% |
| Tsimshian | 17.9 /100 | #198 | Poor 64.3% |
| Panamanians | 17.0 /100 | #199 | Poor 64.3% |
| Nigerians | 16.7 /100 | #200 | Poor 64.3% |
| French Canadians | 16.3 /100 | #201 | Poor 64.2% |
| South Americans | 16.2 /100 | #202 | Poor 64.2% |
| Uruguayans | 15.6 /100 | #203 | Poor 64.2% |
| Immigrants | Zaire | 14.6 /100 | #204 | Poor 64.1% |
| Peruvians | 13.7 /100 | #205 | Poor 64.1% |
| Whites/Caucasians | 12.8 /100 | #206 | Poor 64.0% |
| Colombians | 12.4 /100 | #207 | Poor 64.0% |
| Immigrants | Vietnam | 12.1 /100 | #208 | Poor 64.0% |
| Puget Sound Salish | 11.3 /100 | #209 | Poor 63.9% |
| Ghanaians | 11.2 /100 | #210 | Poor 63.9% |
| Native Hawaiians | 10.6 /100 | #211 | Poor 63.9% |
Demographics Similar to Choctaw by College, Under 1 year
In terms of college, under 1 year, the demographic groups most similar to Choctaw are Ecuadorian (59.3%, a difference of 0.040%), Black/African American (59.4%, a difference of 0.070%), Creek (59.3%, a difference of 0.13%), Sioux (59.4%, a difference of 0.17%), and Nicaraguan (59.2%, a difference of 0.17%).
| Demographics | Rating | Rank | College, Under 1 year |
| Belizeans | 0.1 /100 | #282 | Tragic 60.1% |
| Immigrants | Jamaica | 0.0 /100 | #283 | Tragic 59.7% |
| Immigrants | St. Vincent and the Grenadines | 0.0 /100 | #284 | Tragic 59.6% |
| Paiute | 0.0 /100 | #285 | Tragic 59.6% |
| British West Indians | 0.0 /100 | #286 | Tragic 59.5% |
| Sioux | 0.0 /100 | #287 | Tragic 59.4% |
| Blacks/African Americans | 0.0 /100 | #288 | Tragic 59.4% |
| Choctaw | 0.0 /100 | #289 | Tragic 59.3% |
| Ecuadorians | 0.0 /100 | #290 | Tragic 59.3% |
| Creek | 0.0 /100 | #291 | Tragic 59.3% |
| Nicaraguans | 0.0 /100 | #292 | Tragic 59.2% |
| Seminole | 0.0 /100 | #293 | Tragic 59.1% |
| Immigrants | Belize | 0.0 /100 | #294 | Tragic 59.1% |
| Immigrants | Grenada | 0.0 /100 | #295 | Tragic 59.1% |
| Central American Indians | 0.0 /100 | #296 | Tragic 59.0% |