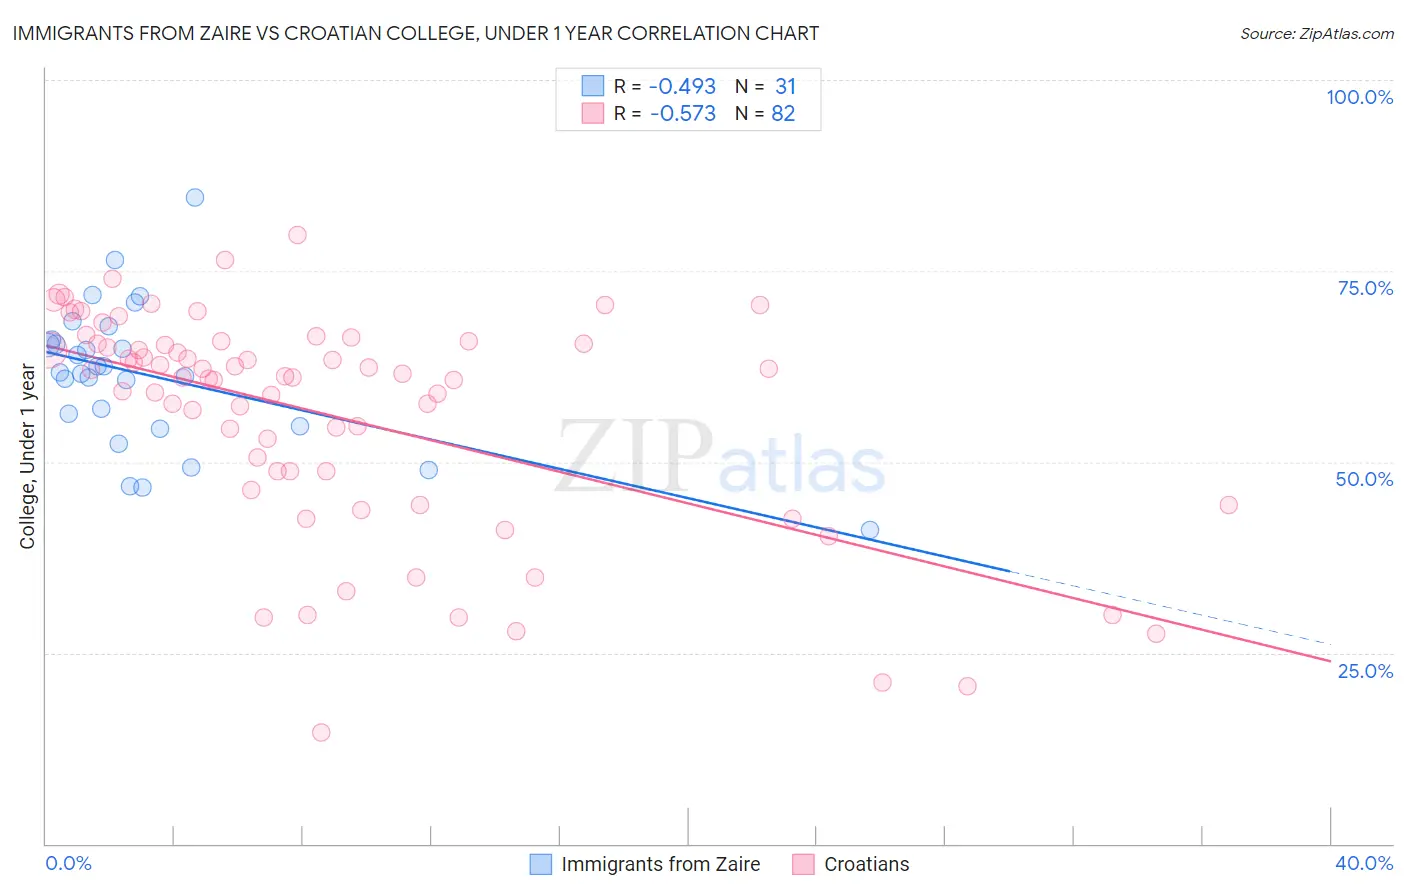
Immigrants from Zaire vs Croatian College, Under 1 year
COMPARE
Immigrants from Zaire
Croatian
College, Under 1 year
College, Under 1 year Comparison
Immigrants from Zaire
Croatians
64.1%
COLLEGE, UNDER 1 YEAR
14.6/ 100
METRIC RATING
204th/ 347
METRIC RANK
68.3%
COLLEGE, UNDER 1 YEAR
98.2/ 100
METRIC RATING
88th/ 347
METRIC RANK
Immigrants from Zaire vs Croatian College, Under 1 year Correlation Chart
The statistical analysis conducted on geographies consisting of 107,255,700 people shows a moderate negative correlation between the proportion of Immigrants from Zaire and percentage of population with at least college, under 1 year education in the United States with a correlation coefficient (R) of -0.493 and weighted average of 64.1%. Similarly, the statistical analysis conducted on geographies consisting of 375,730,237 people shows a substantial negative correlation between the proportion of Croatians and percentage of population with at least college, under 1 year education in the United States with a correlation coefficient (R) of -0.573 and weighted average of 68.3%, a difference of 6.5%.
College, Under 1 year Correlation Summary
| Measurement | Immigrants from Zaire | Croatian |
| Minimum | 41.0% | 14.6% |
| Maximum | 84.6% | 79.7% |
| Range | 43.5% | 65.1% |
| Mean | 61.3% | 56.1% |
| Median | 61.7% | 61.1% |
| Interquartile 25% (IQ1) | 54.7% | 48.7% |
| Interquartile 75% (IQ3) | 66.0% | 65.5% |
| Interquartile Range (IQR) | 11.3% | 16.8% |
| Standard Deviation (Sample) | 9.3% | 14.5% |
| Standard Deviation (Population) | 9.2% | 14.5% |
Similar Demographics by College, Under 1 year
Demographics Similar to Immigrants from Zaire by College, Under 1 year
In terms of college, under 1 year, the demographic groups most similar to Immigrants from Zaire are Peruvian (64.1%, a difference of 0.080%), Uruguayan (64.2%, a difference of 0.090%), French Canadian (64.2%, a difference of 0.14%), South American (64.2%, a difference of 0.14%), and White/Caucasian (64.0%, a difference of 0.17%).
| Demographics | Rating | Rank | College, Under 1 year |
| Costa Ricans | 19.6 /100 | #197 | Poor 64.4% |
| Tsimshian | 17.9 /100 | #198 | Poor 64.3% |
| Panamanians | 17.0 /100 | #199 | Poor 64.3% |
| Nigerians | 16.7 /100 | #200 | Poor 64.3% |
| French Canadians | 16.3 /100 | #201 | Poor 64.2% |
| South Americans | 16.2 /100 | #202 | Poor 64.2% |
| Uruguayans | 15.6 /100 | #203 | Poor 64.2% |
| Immigrants | Zaire | 14.6 /100 | #204 | Poor 64.1% |
| Peruvians | 13.7 /100 | #205 | Poor 64.1% |
| Whites/Caucasians | 12.8 /100 | #206 | Poor 64.0% |
| Colombians | 12.4 /100 | #207 | Poor 64.0% |
| Immigrants | Vietnam | 12.1 /100 | #208 | Poor 64.0% |
| Puget Sound Salish | 11.3 /100 | #209 | Poor 63.9% |
| Ghanaians | 11.2 /100 | #210 | Poor 63.9% |
| Native Hawaiians | 10.6 /100 | #211 | Poor 63.9% |
Demographics Similar to Croatians by College, Under 1 year
In terms of college, under 1 year, the demographic groups most similar to Croatians are Ethiopian (68.3%, a difference of 0.010%), Chinese (68.3%, a difference of 0.020%), Immigrants from Lebanon (68.3%, a difference of 0.040%), Immigrants from Hungary (68.3%, a difference of 0.050%), and Egyptian (68.3%, a difference of 0.050%).
| Demographics | Rating | Rank | College, Under 1 year |
| Immigrants | Greece | 98.5 /100 | #81 | Exceptional 68.4% |
| Norwegians | 98.4 /100 | #82 | Exceptional 68.4% |
| Argentineans | 98.4 /100 | #83 | Exceptional 68.4% |
| Immigrants | Hungary | 98.3 /100 | #84 | Exceptional 68.3% |
| Egyptians | 98.3 /100 | #85 | Exceptional 68.3% |
| Immigrants | Lebanon | 98.3 /100 | #86 | Exceptional 68.3% |
| Chinese | 98.3 /100 | #87 | Exceptional 68.3% |
| Croatians | 98.2 /100 | #88 | Exceptional 68.3% |
| Ethiopians | 98.2 /100 | #89 | Exceptional 68.3% |
| Icelanders | 98.1 /100 | #90 | Exceptional 68.3% |
| Europeans | 98.1 /100 | #91 | Exceptional 68.2% |
| Luxembourgers | 98.1 /100 | #92 | Exceptional 68.2% |
| Romanians | 97.9 /100 | #93 | Exceptional 68.2% |
| Armenians | 97.7 /100 | #94 | Exceptional 68.1% |
| Immigrants | Pakistan | 97.5 /100 | #95 | Exceptional 68.0% |