Immigrants from Zaire vs Carpatho Rusyn College, Under 1 year
COMPARE
Immigrants from Zaire
Carpatho Rusyn
College, Under 1 year
College, Under 1 year Comparison
Immigrants from Zaire
Carpatho Rusyns
64.1%
COLLEGE, UNDER 1 YEAR
14.6/ 100
METRIC RATING
204th/ 347
METRIC RANK
67.9%
COLLEGE, UNDER 1 YEAR
96.8/ 100
METRIC RATING
103rd/ 347
METRIC RANK
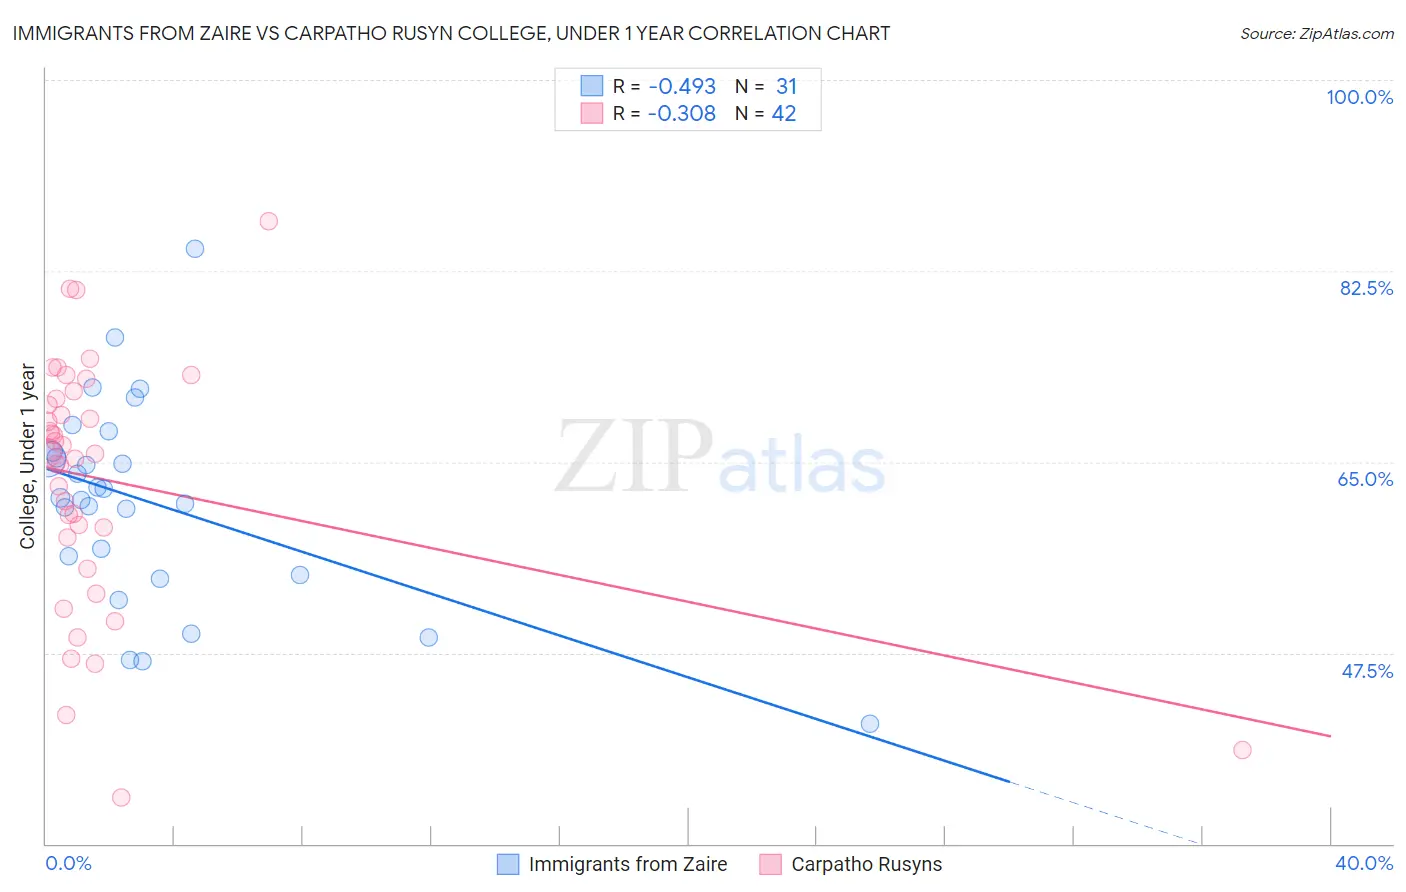
Immigrants from Zaire vs Carpatho Rusyn College, Under 1 year Correlation Chart
The statistical analysis conducted on geographies consisting of 107,255,700 people shows a moderate negative correlation between the proportion of Immigrants from Zaire and percentage of population with at least college, under 1 year education in the United States with a correlation coefficient (R) of -0.493 and weighted average of 64.1%. Similarly, the statistical analysis conducted on geographies consisting of 58,871,690 people shows a mild negative correlation between the proportion of Carpatho Rusyns and percentage of population with at least college, under 1 year education in the United States with a correlation coefficient (R) of -0.308 and weighted average of 67.9%, a difference of 5.8%.
College, Under 1 year Correlation Summary
| Measurement | Immigrants from Zaire | Carpatho Rusyn |
| Minimum | 41.0% | 34.2% |
| Maximum | 84.6% | 87.0% |
| Range | 43.5% | 52.8% |
| Mean | 61.3% | 63.3% |
| Median | 61.7% | 65.8% |
| Interquartile 25% (IQ1) | 54.7% | 58.1% |
| Interquartile 75% (IQ3) | 66.0% | 70.8% |
| Interquartile Range (IQR) | 11.3% | 12.7% |
| Standard Deviation (Sample) | 9.3% | 11.5% |
| Standard Deviation (Population) | 9.2% | 11.3% |
Similar Demographics by College, Under 1 year
Demographics Similar to Immigrants from Zaire by College, Under 1 year
In terms of college, under 1 year, the demographic groups most similar to Immigrants from Zaire are Peruvian (64.1%, a difference of 0.080%), Uruguayan (64.2%, a difference of 0.090%), French Canadian (64.2%, a difference of 0.14%), South American (64.2%, a difference of 0.14%), and White/Caucasian (64.0%, a difference of 0.17%).
| Demographics | Rating | Rank | College, Under 1 year |
| Costa Ricans | 19.6 /100 | #197 | Poor 64.4% |
| Tsimshian | 17.9 /100 | #198 | Poor 64.3% |
| Panamanians | 17.0 /100 | #199 | Poor 64.3% |
| Nigerians | 16.7 /100 | #200 | Poor 64.3% |
| French Canadians | 16.3 /100 | #201 | Poor 64.2% |
| South Americans | 16.2 /100 | #202 | Poor 64.2% |
| Uruguayans | 15.6 /100 | #203 | Poor 64.2% |
| Immigrants | Zaire | 14.6 /100 | #204 | Poor 64.1% |
| Peruvians | 13.7 /100 | #205 | Poor 64.1% |
| Whites/Caucasians | 12.8 /100 | #206 | Poor 64.0% |
| Colombians | 12.4 /100 | #207 | Poor 64.0% |
| Immigrants | Vietnam | 12.1 /100 | #208 | Poor 64.0% |
| Puget Sound Salish | 11.3 /100 | #209 | Poor 63.9% |
| Ghanaians | 11.2 /100 | #210 | Poor 63.9% |
| Native Hawaiians | 10.6 /100 | #211 | Poor 63.9% |
Demographics Similar to Carpatho Rusyns by College, Under 1 year
In terms of college, under 1 year, the demographic groups most similar to Carpatho Rusyns are Immigrants from Eastern Europe (67.9%, a difference of 0.010%), Palestinian (67.9%, a difference of 0.010%), Immigrants from Argentina (67.9%, a difference of 0.060%), Immigrants from Bolivia (67.9%, a difference of 0.070%), and Immigrants from Western Asia (67.8%, a difference of 0.070%).
| Demographics | Rating | Rank | College, Under 1 year |
| Jordanians | 97.4 /100 | #96 | Exceptional 68.0% |
| Immigrants | Ethiopia | 97.3 /100 | #97 | Exceptional 68.0% |
| Paraguayans | 97.1 /100 | #98 | Exceptional 67.9% |
| Immigrants | Bolivia | 97.0 /100 | #99 | Exceptional 67.9% |
| Immigrants | Argentina | 97.0 /100 | #100 | Exceptional 67.9% |
| Immigrants | Eastern Europe | 96.9 /100 | #101 | Exceptional 67.9% |
| Palestinians | 96.9 /100 | #102 | Exceptional 67.9% |
| Carpatho Rusyns | 96.8 /100 | #103 | Exceptional 67.9% |
| Immigrants | Western Asia | 96.6 /100 | #104 | Exceptional 67.8% |
| Afghans | 96.6 /100 | #105 | Exceptional 67.8% |
| Immigrants | Croatia | 96.6 /100 | #106 | Exceptional 67.8% |
| Austrians | 96.4 /100 | #107 | Exceptional 67.8% |
| Immigrants | Egypt | 96.0 /100 | #108 | Exceptional 67.7% |
| Scandinavians | 95.8 /100 | #109 | Exceptional 67.7% |
| Assyrians/Chaldeans/Syriacs | 95.8 /100 | #110 | Exceptional 67.7% |