Canadian vs Immigrants from Egypt GED/Equivalency
COMPARE
Canadian
Immigrants from Egypt
GED/Equivalency
GED/Equivalency Comparison
Canadians
Immigrants from Egypt
87.1%
GED/EQUIVALENCY
95.6/ 100
METRIC RATING
108th/ 347
METRIC RANK
86.7%
GED/EQUIVALENCY
90.4/ 100
METRIC RATING
124th/ 347
METRIC RANK
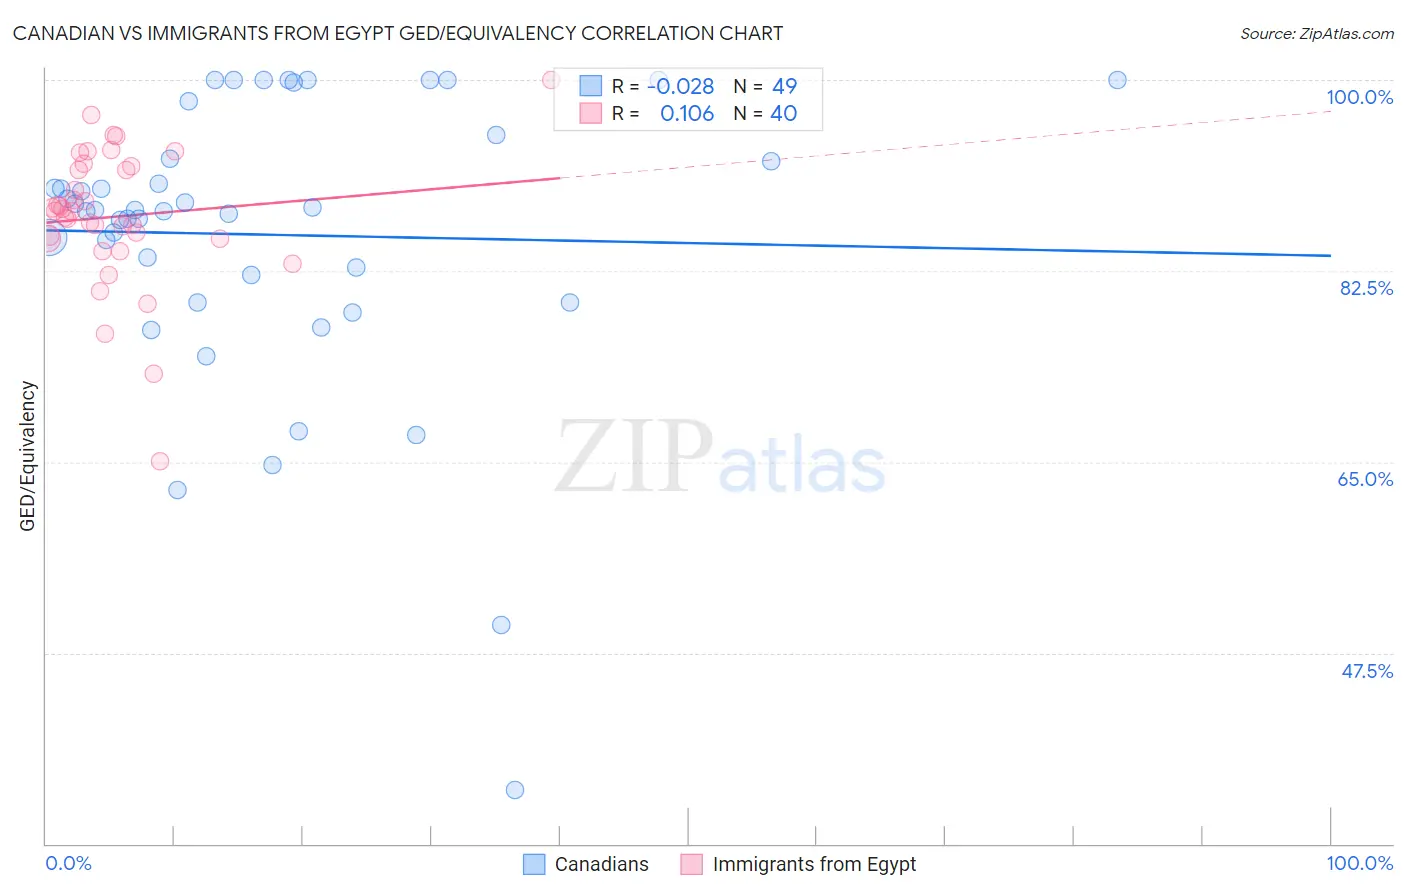
Canadian vs Immigrants from Egypt GED/Equivalency Correlation Chart
The statistical analysis conducted on geographies consisting of 437,556,595 people shows no correlation between the proportion of Canadians and percentage of population with at least ged/equivalency education in the United States with a correlation coefficient (R) of -0.028 and weighted average of 87.1%. Similarly, the statistical analysis conducted on geographies consisting of 245,485,633 people shows a poor positive correlation between the proportion of Immigrants from Egypt and percentage of population with at least ged/equivalency education in the United States with a correlation coefficient (R) of 0.106 and weighted average of 86.7%, a difference of 0.42%.
GED/Equivalency Correlation Summary
| Measurement | Canadian | Immigrants from Egypt |
| Minimum | 34.9% | 65.1% |
| Maximum | 100.0% | 100.0% |
| Range | 65.1% | 34.9% |
| Mean | 85.8% | 87.5% |
| Median | 88.1% | 88.0% |
| Interquartile 25% (IQ1) | 80.9% | 85.5% |
| Interquartile 75% (IQ3) | 93.9% | 92.0% |
| Interquartile Range (IQR) | 13.0% | 6.5% |
| Standard Deviation (Sample) | 13.3% | 6.4% |
| Standard Deviation (Population) | 13.1% | 6.3% |
Demographics Similar to Canadians and Immigrants from Egypt by GED/Equivalency
In terms of ged/equivalency, the demographic groups most similar to Canadians are Immigrants from Eastern Europe (87.1%, a difference of 0.010%), Icelander (87.1%, a difference of 0.020%), Immigrants from Zimbabwe (87.1%, a difference of 0.030%), Egyptian (87.1%, a difference of 0.040%), and French (87.1%, a difference of 0.040%). Similarly, the demographic groups most similar to Immigrants from Egypt are Celtic (86.7%, a difference of 0.0%), Immigrants from Italy (86.7%, a difference of 0.010%), Asian (86.7%, a difference of 0.010%), Immigrants from Lebanon (86.8%, a difference of 0.030%), and Immigrants from Jordan (86.8%, a difference of 0.030%).
| Demographics | Rating | Rank | GED/Equivalency |
| Immigrants | Zimbabwe | 95.8 /100 | #106 | Exceptional 87.1% |
| Icelanders | 95.7 /100 | #107 | Exceptional 87.1% |
| Canadians | 95.6 /100 | #108 | Exceptional 87.1% |
| Immigrants | Eastern Europe | 95.5 /100 | #109 | Exceptional 87.1% |
| Egyptians | 95.3 /100 | #110 | Exceptional 87.1% |
| French | 95.2 /100 | #111 | Exceptional 87.1% |
| Tlingit-Haida | 94.8 /100 | #112 | Exceptional 87.0% |
| Assyrians/Chaldeans/Syriacs | 94.8 /100 | #113 | Exceptional 87.0% |
| Immigrants | Kazakhstan | 94.7 /100 | #114 | Exceptional 87.0% |
| Mongolians | 94.6 /100 | #115 | Exceptional 87.0% |
| Swiss | 94.5 /100 | #116 | Exceptional 87.0% |
| Immigrants | Hong Kong | 93.8 /100 | #117 | Exceptional 86.9% |
| French Canadians | 93.2 /100 | #118 | Exceptional 86.9% |
| Immigrants | China | 93.2 /100 | #119 | Exceptional 86.9% |
| Scotch-Irish | 91.6 /100 | #120 | Exceptional 86.8% |
| Immigrants | Lebanon | 90.9 /100 | #121 | Exceptional 86.8% |
| Immigrants | Jordan | 90.8 /100 | #122 | Exceptional 86.8% |
| Immigrants | Italy | 90.5 /100 | #123 | Exceptional 86.7% |
| Immigrants | Egypt | 90.4 /100 | #124 | Exceptional 86.7% |
| Celtics | 90.4 /100 | #125 | Exceptional 86.7% |
| Asians | 90.3 /100 | #126 | Exceptional 86.7% |