Immigrants from Uzbekistan vs Immigrants from India College, Under 1 year
COMPARE
Immigrants from Uzbekistan
Immigrants from India
College, Under 1 year
College, Under 1 year Comparison
Immigrants from Uzbekistan
Immigrants from India
65.8%
COLLEGE, UNDER 1 YEAR
61.6/ 100
METRIC RATING
165th/ 347
METRIC RANK
74.4%
COLLEGE, UNDER 1 YEAR
100.0/ 100
METRIC RATING
4th/ 347
METRIC RANK
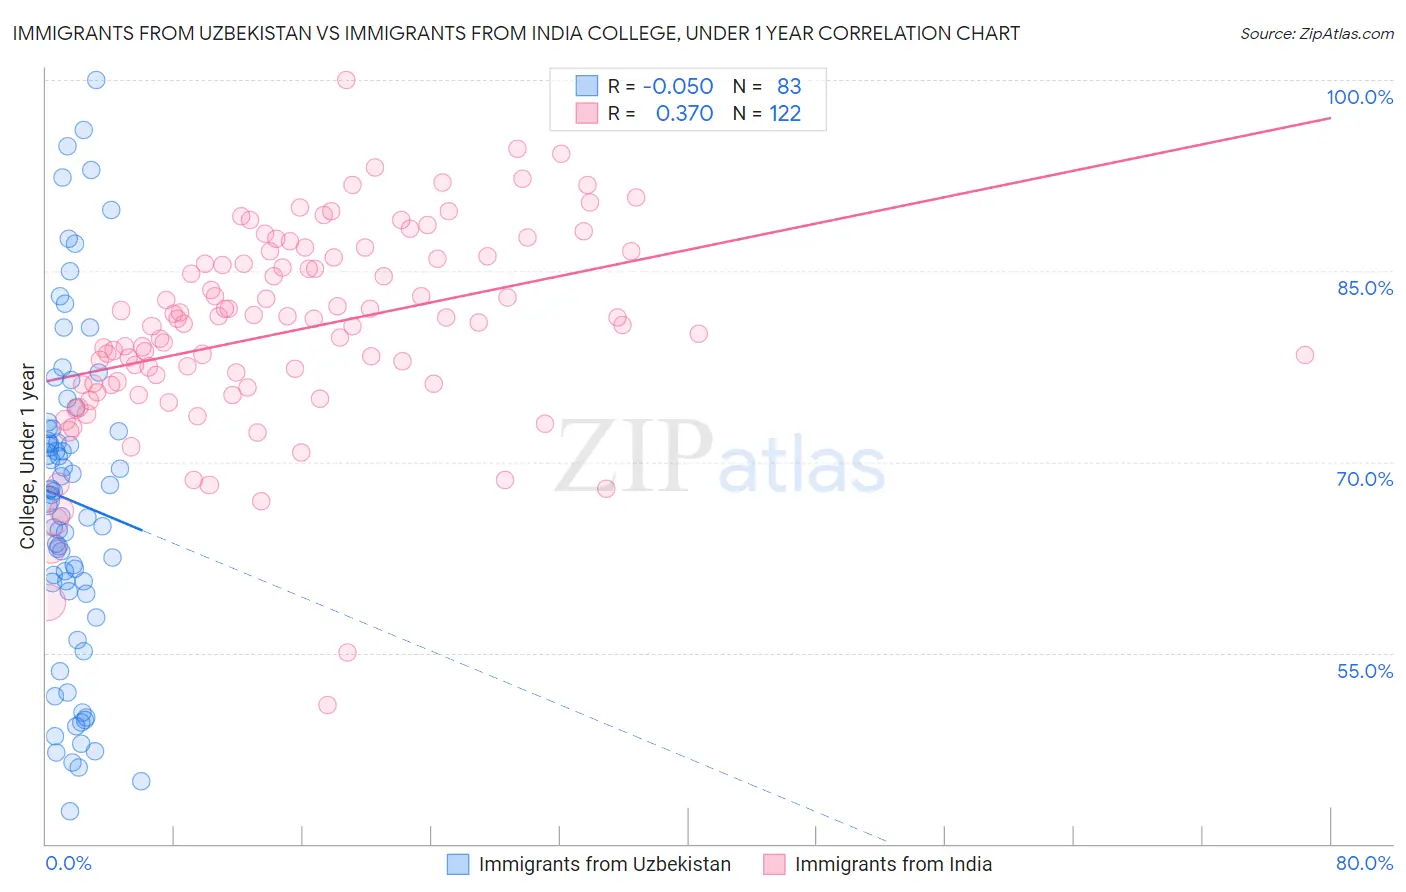
Immigrants from Uzbekistan vs Immigrants from India College, Under 1 year Correlation Chart
The statistical analysis conducted on geographies consisting of 118,765,305 people shows no correlation between the proportion of Immigrants from Uzbekistan and percentage of population with at least college, under 1 year education in the United States with a correlation coefficient (R) of -0.050 and weighted average of 65.8%. Similarly, the statistical analysis conducted on geographies consisting of 434,101,057 people shows a mild positive correlation between the proportion of Immigrants from India and percentage of population with at least college, under 1 year education in the United States with a correlation coefficient (R) of 0.370 and weighted average of 74.4%, a difference of 13.2%.
College, Under 1 year Correlation Summary
| Measurement | Immigrants from Uzbekistan | Immigrants from India |
| Minimum | 42.6% | 50.9% |
| Maximum | 100.0% | 100.0% |
| Range | 57.4% | 49.1% |
| Mean | 67.0% | 80.2% |
| Median | 67.4% | 80.9% |
| Interquartile 25% (IQ1) | 59.9% | 76.0% |
| Interquartile 75% (IQ3) | 72.6% | 85.9% |
| Interquartile Range (IQR) | 12.7% | 9.9% |
| Standard Deviation (Sample) | 12.9% | 8.0% |
| Standard Deviation (Population) | 12.9% | 8.0% |
Similar Demographics by College, Under 1 year
Demographics Similar to Immigrants from Uzbekistan by College, Under 1 year
In terms of college, under 1 year, the demographic groups most similar to Immigrants from Uzbekistan are Somali (65.8%, a difference of 0.050%), Czechoslovakian (65.8%, a difference of 0.050%), Korean (65.9%, a difference of 0.17%), Brazilian (65.9%, a difference of 0.21%), and Albanian (65.9%, a difference of 0.22%).
| Demographics | Rating | Rank | College, Under 1 year |
| Celtics | 67.3 /100 | #158 | Good 65.9% |
| Tlingit-Haida | 66.4 /100 | #159 | Good 65.9% |
| Albanians | 66.1 /100 | #160 | Good 65.9% |
| Brazilians | 66.0 /100 | #161 | Good 65.9% |
| Koreans | 65.3 /100 | #162 | Good 65.9% |
| Somalis | 62.7 /100 | #163 | Good 65.8% |
| Czechoslovakians | 62.6 /100 | #164 | Good 65.8% |
| Immigrants | Uzbekistan | 61.6 /100 | #165 | Good 65.8% |
| Moroccans | 56.7 /100 | #166 | Average 65.6% |
| Immigrants | Somalia | 56.4 /100 | #167 | Average 65.6% |
| Hungarians | 55.9 /100 | #168 | Average 65.6% |
| Yugoslavians | 55.7 /100 | #169 | Average 65.6% |
| Germans | 55.7 /100 | #170 | Average 65.6% |
| Immigrants | Oceania | 55.0 /100 | #171 | Average 65.6% |
| South American Indians | 54.4 /100 | #172 | Average 65.5% |
Demographics Similar to Immigrants from India by College, Under 1 year
In terms of college, under 1 year, the demographic groups most similar to Immigrants from India are Immigrants from Iran (74.3%, a difference of 0.23%), Immigrants from Taiwan (74.2%, a difference of 0.34%), Immigrants from Singapore (74.8%, a difference of 0.51%), Iranian (74.9%, a difference of 0.56%), and Okinawan (73.7%, a difference of 1.0%).
| Demographics | Rating | Rank | College, Under 1 year |
| Filipinos | 100.0 /100 | #1 | Exceptional 75.5% |
| Iranians | 100.0 /100 | #2 | Exceptional 74.9% |
| Immigrants | Singapore | 100.0 /100 | #3 | Exceptional 74.8% |
| Immigrants | India | 100.0 /100 | #4 | Exceptional 74.4% |
| Immigrants | Iran | 100.0 /100 | #5 | Exceptional 74.3% |
| Immigrants | Taiwan | 100.0 /100 | #6 | Exceptional 74.2% |
| Okinawans | 100.0 /100 | #7 | Exceptional 73.7% |
| Thais | 100.0 /100 | #8 | Exceptional 73.4% |
| Immigrants | Australia | 100.0 /100 | #9 | Exceptional 72.7% |
| Immigrants | Israel | 100.0 /100 | #10 | Exceptional 72.3% |
| Immigrants | South Central Asia | 100.0 /100 | #11 | Exceptional 72.1% |
| Immigrants | Sweden | 100.0 /100 | #12 | Exceptional 72.1% |
| Cypriots | 100.0 /100 | #13 | Exceptional 72.0% |
| Cambodians | 100.0 /100 | #14 | Exceptional 71.9% |
| Burmese | 100.0 /100 | #15 | Exceptional 71.9% |