Immigrants from Uzbekistan vs Immigrants from Cameroon College, Under 1 year
COMPARE
Immigrants from Uzbekistan
Immigrants from Cameroon
College, Under 1 year
College, Under 1 year Comparison
Immigrants from Uzbekistan
Immigrants from Cameroon
65.8%
COLLEGE, UNDER 1 YEAR
61.6/ 100
METRIC RATING
165th/ 347
METRIC RANK
64.6%
COLLEGE, UNDER 1 YEAR
24.6/ 100
METRIC RATING
194th/ 347
METRIC RANK
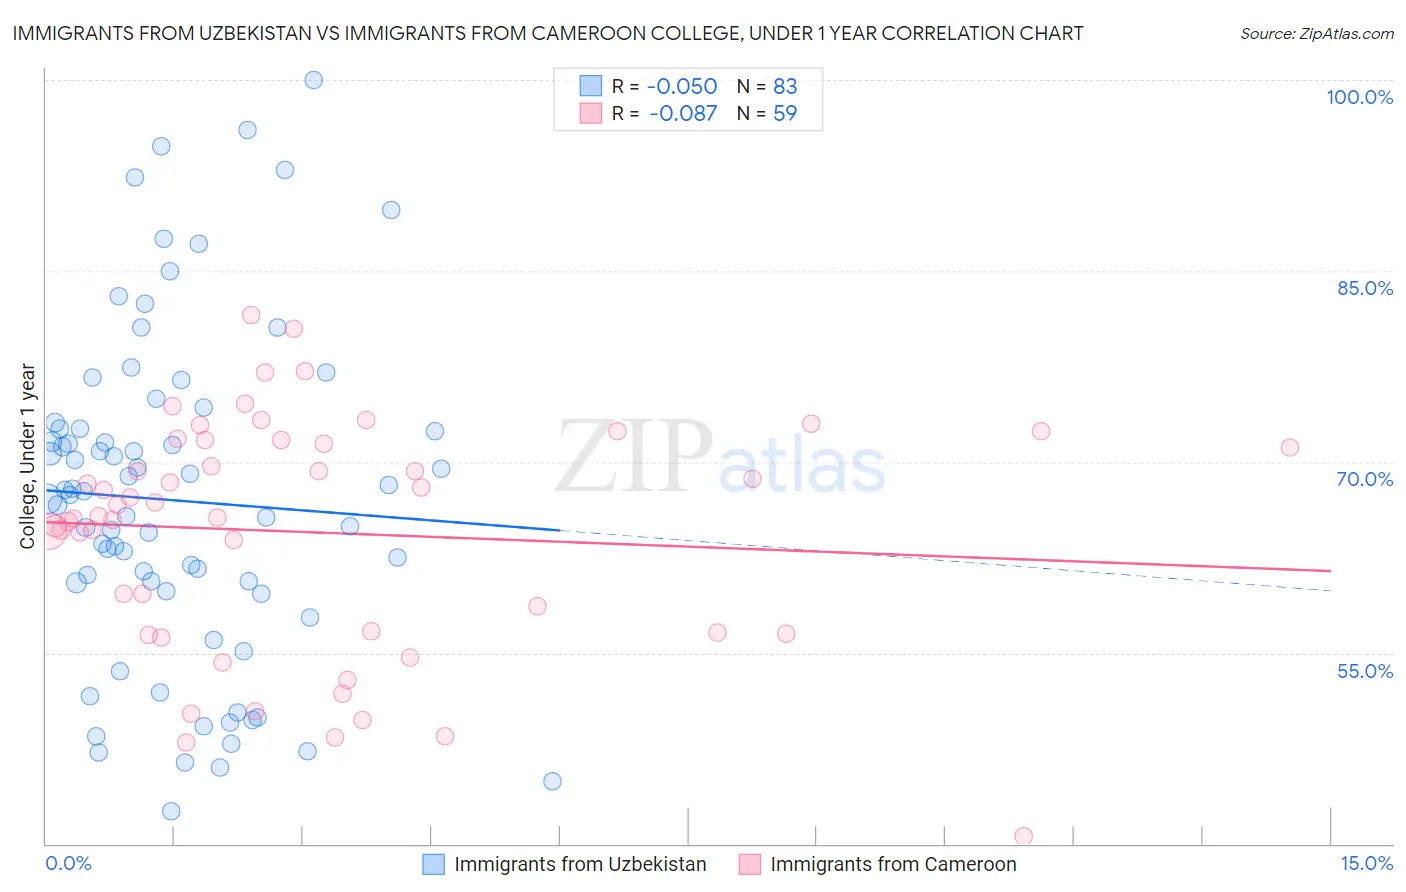
Immigrants from Uzbekistan vs Immigrants from Cameroon College, Under 1 year Correlation Chart
The statistical analysis conducted on geographies consisting of 118,765,305 people shows no correlation between the proportion of Immigrants from Uzbekistan and percentage of population with at least college, under 1 year education in the United States with a correlation coefficient (R) of -0.050 and weighted average of 65.8%. Similarly, the statistical analysis conducted on geographies consisting of 130,767,721 people shows a slight negative correlation between the proportion of Immigrants from Cameroon and percentage of population with at least college, under 1 year education in the United States with a correlation coefficient (R) of -0.087 and weighted average of 64.6%, a difference of 1.8%.
College, Under 1 year Correlation Summary
| Measurement | Immigrants from Uzbekistan | Immigrants from Cameroon |
| Minimum | 42.6% | 40.6% |
| Maximum | 100.0% | 81.6% |
| Range | 57.4% | 41.0% |
| Mean | 67.0% | 64.5% |
| Median | 67.4% | 65.7% |
| Interquartile 25% (IQ1) | 59.9% | 56.5% |
| Interquartile 75% (IQ3) | 72.6% | 71.7% |
| Interquartile Range (IQR) | 12.7% | 15.2% |
| Standard Deviation (Sample) | 12.9% | 9.1% |
| Standard Deviation (Population) | 12.9% | 9.0% |
Similar Demographics by College, Under 1 year
Demographics Similar to Immigrants from Uzbekistan by College, Under 1 year
In terms of college, under 1 year, the demographic groups most similar to Immigrants from Uzbekistan are Somali (65.8%, a difference of 0.050%), Czechoslovakian (65.8%, a difference of 0.050%), Korean (65.9%, a difference of 0.17%), Brazilian (65.9%, a difference of 0.21%), and Albanian (65.9%, a difference of 0.22%).
| Demographics | Rating | Rank | College, Under 1 year |
| Celtics | 67.3 /100 | #158 | Good 65.9% |
| Tlingit-Haida | 66.4 /100 | #159 | Good 65.9% |
| Albanians | 66.1 /100 | #160 | Good 65.9% |
| Brazilians | 66.0 /100 | #161 | Good 65.9% |
| Koreans | 65.3 /100 | #162 | Good 65.9% |
| Somalis | 62.7 /100 | #163 | Good 65.8% |
| Czechoslovakians | 62.6 /100 | #164 | Good 65.8% |
| Immigrants | Uzbekistan | 61.6 /100 | #165 | Good 65.8% |
| Moroccans | 56.7 /100 | #166 | Average 65.6% |
| Immigrants | Somalia | 56.4 /100 | #167 | Average 65.6% |
| Hungarians | 55.9 /100 | #168 | Average 65.6% |
| Yugoslavians | 55.7 /100 | #169 | Average 65.6% |
| Germans | 55.7 /100 | #170 | Average 65.6% |
| Immigrants | Oceania | 55.0 /100 | #171 | Average 65.6% |
| South American Indians | 54.4 /100 | #172 | Average 65.5% |
Demographics Similar to Immigrants from Cameroon by College, Under 1 year
In terms of college, under 1 year, the demographic groups most similar to Immigrants from Cameroon are Slovak (64.7%, a difference of 0.13%), Immigrants from Thailand (64.7%, a difference of 0.14%), Immigrants from South Eastern Asia (64.5%, a difference of 0.16%), Immigrants from Armenia (64.7%, a difference of 0.20%), and Tongan (64.5%, a difference of 0.21%).
| Demographics | Rating | Rank | College, Under 1 year |
| Immigrants | Southern Europe | 34.3 /100 | #187 | Fair 64.9% |
| Immigrants | Albania | 32.0 /100 | #188 | Fair 64.9% |
| Spanish | 31.6 /100 | #189 | Fair 64.9% |
| Immigrants | Philippines | 30.1 /100 | #190 | Fair 64.8% |
| Immigrants | Armenia | 28.1 /100 | #191 | Fair 64.7% |
| Immigrants | Thailand | 27.0 /100 | #192 | Fair 64.7% |
| Slovaks | 26.7 /100 | #193 | Fair 64.7% |
| Immigrants | Cameroon | 24.6 /100 | #194 | Fair 64.6% |
| Immigrants | South Eastern Asia | 22.1 /100 | #195 | Fair 64.5% |
| Tongans | 21.2 /100 | #196 | Fair 64.5% |
| Costa Ricans | 19.6 /100 | #197 | Poor 64.4% |
| Tsimshian | 17.9 /100 | #198 | Poor 64.3% |
| Panamanians | 17.0 /100 | #199 | Poor 64.3% |
| Nigerians | 16.7 /100 | #200 | Poor 64.3% |
| French Canadians | 16.3 /100 | #201 | Poor 64.2% |