Immigrants from Uzbekistan vs Northern European College, Under 1 year
COMPARE
Immigrants from Uzbekistan
Northern European
College, Under 1 year
College, Under 1 year Comparison
Immigrants from Uzbekistan
Northern Europeans
65.8%
COLLEGE, UNDER 1 YEAR
61.6/ 100
METRIC RATING
165th/ 347
METRIC RANK
69.0%
COLLEGE, UNDER 1 YEAR
99.4/ 100
METRIC RATING
64th/ 347
METRIC RANK
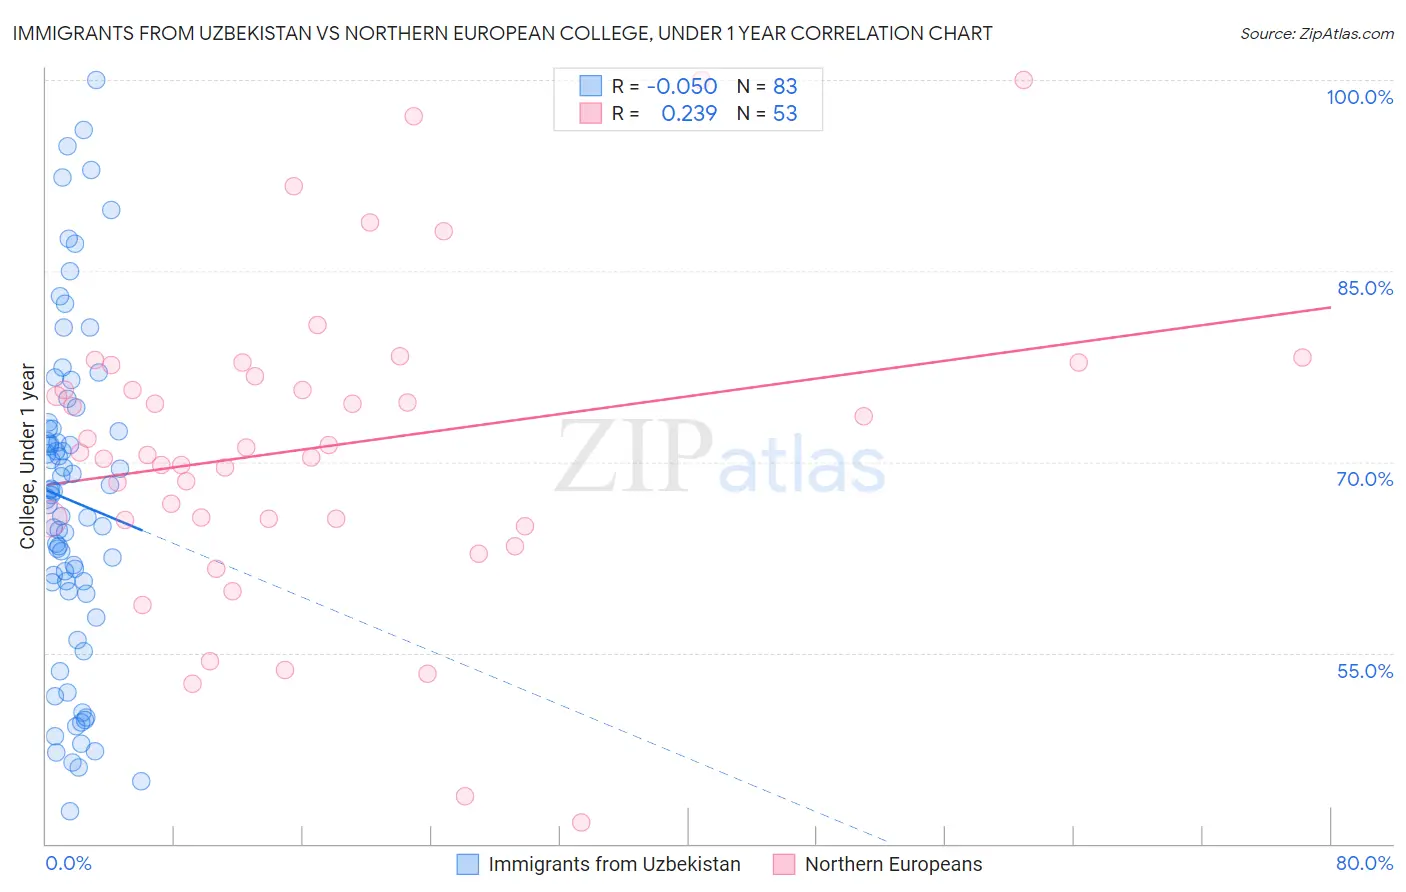
Immigrants from Uzbekistan vs Northern European College, Under 1 year Correlation Chart
The statistical analysis conducted on geographies consisting of 118,765,305 people shows no correlation between the proportion of Immigrants from Uzbekistan and percentage of population with at least college, under 1 year education in the United States with a correlation coefficient (R) of -0.050 and weighted average of 65.8%. Similarly, the statistical analysis conducted on geographies consisting of 406,096,233 people shows a weak positive correlation between the proportion of Northern Europeans and percentage of population with at least college, under 1 year education in the United States with a correlation coefficient (R) of 0.239 and weighted average of 69.0%, a difference of 5.0%.
College, Under 1 year Correlation Summary
| Measurement | Immigrants from Uzbekistan | Northern European |
| Minimum | 42.6% | 41.7% |
| Maximum | 100.0% | 100.0% |
| Range | 57.4% | 58.3% |
| Mean | 67.0% | 71.2% |
| Median | 67.4% | 70.7% |
| Interquartile 25% (IQ1) | 59.9% | 65.5% |
| Interquartile 75% (IQ3) | 72.6% | 77.2% |
| Interquartile Range (IQR) | 12.7% | 11.7% |
| Standard Deviation (Sample) | 12.9% | 12.0% |
| Standard Deviation (Population) | 12.9% | 11.9% |
Similar Demographics by College, Under 1 year
Demographics Similar to Immigrants from Uzbekistan by College, Under 1 year
In terms of college, under 1 year, the demographic groups most similar to Immigrants from Uzbekistan are Somali (65.8%, a difference of 0.050%), Czechoslovakian (65.8%, a difference of 0.050%), Korean (65.9%, a difference of 0.17%), Brazilian (65.9%, a difference of 0.21%), and Albanian (65.9%, a difference of 0.22%).
| Demographics | Rating | Rank | College, Under 1 year |
| Celtics | 67.3 /100 | #158 | Good 65.9% |
| Tlingit-Haida | 66.4 /100 | #159 | Good 65.9% |
| Albanians | 66.1 /100 | #160 | Good 65.9% |
| Brazilians | 66.0 /100 | #161 | Good 65.9% |
| Koreans | 65.3 /100 | #162 | Good 65.9% |
| Somalis | 62.7 /100 | #163 | Good 65.8% |
| Czechoslovakians | 62.6 /100 | #164 | Good 65.8% |
| Immigrants | Uzbekistan | 61.6 /100 | #165 | Good 65.8% |
| Moroccans | 56.7 /100 | #166 | Average 65.6% |
| Immigrants | Somalia | 56.4 /100 | #167 | Average 65.6% |
| Hungarians | 55.9 /100 | #168 | Average 65.6% |
| Yugoslavians | 55.7 /100 | #169 | Average 65.6% |
| Germans | 55.7 /100 | #170 | Average 65.6% |
| Immigrants | Oceania | 55.0 /100 | #171 | Average 65.6% |
| South American Indians | 54.4 /100 | #172 | Average 65.5% |
Demographics Similar to Northern Europeans by College, Under 1 year
In terms of college, under 1 year, the demographic groups most similar to Northern Europeans are Immigrants from Moldova (69.0%, a difference of 0.020%), Immigrants from Canada (69.1%, a difference of 0.040%), Immigrants from North America (69.0%, a difference of 0.040%), Immigrants from Kazakhstan (69.2%, a difference of 0.17%), and Immigrants from Belarus (69.2%, a difference of 0.17%).
| Demographics | Rating | Rank | College, Under 1 year |
| Asians | 99.6 /100 | #57 | Exceptional 69.4% |
| Immigrants | Malaysia | 99.6 /100 | #58 | Exceptional 69.3% |
| Immigrants | Serbia | 99.5 /100 | #59 | Exceptional 69.3% |
| Immigrants | Asia | 99.5 /100 | #60 | Exceptional 69.2% |
| Immigrants | Kazakhstan | 99.5 /100 | #61 | Exceptional 69.2% |
| Immigrants | Belarus | 99.5 /100 | #62 | Exceptional 69.2% |
| Immigrants | Canada | 99.4 /100 | #63 | Exceptional 69.1% |
| Northern Europeans | 99.4 /100 | #64 | Exceptional 69.0% |
| Immigrants | Moldova | 99.3 /100 | #65 | Exceptional 69.0% |
| Immigrants | North America | 99.3 /100 | #66 | Exceptional 69.0% |
| Immigrants | Zimbabwe | 99.2 /100 | #67 | Exceptional 68.9% |
| Immigrants | Indonesia | 99.2 /100 | #68 | Exceptional 68.9% |
| Immigrants | Romania | 99.2 /100 | #69 | Exceptional 68.9% |
| Lithuanians | 99.1 /100 | #70 | Exceptional 68.8% |
| Immigrants | Europe | 99.1 /100 | #71 | Exceptional 68.8% |