Immigrants from Uzbekistan vs Blackfeet College, Under 1 year
COMPARE
Immigrants from Uzbekistan
Blackfeet
College, Under 1 year
College, Under 1 year Comparison
Immigrants from Uzbekistan
Blackfeet
65.8%
COLLEGE, UNDER 1 YEAR
61.6/ 100
METRIC RATING
165th/ 347
METRIC RANK
61.1%
COLLEGE, UNDER 1 YEAR
0.3/ 100
METRIC RATING
260th/ 347
METRIC RANK
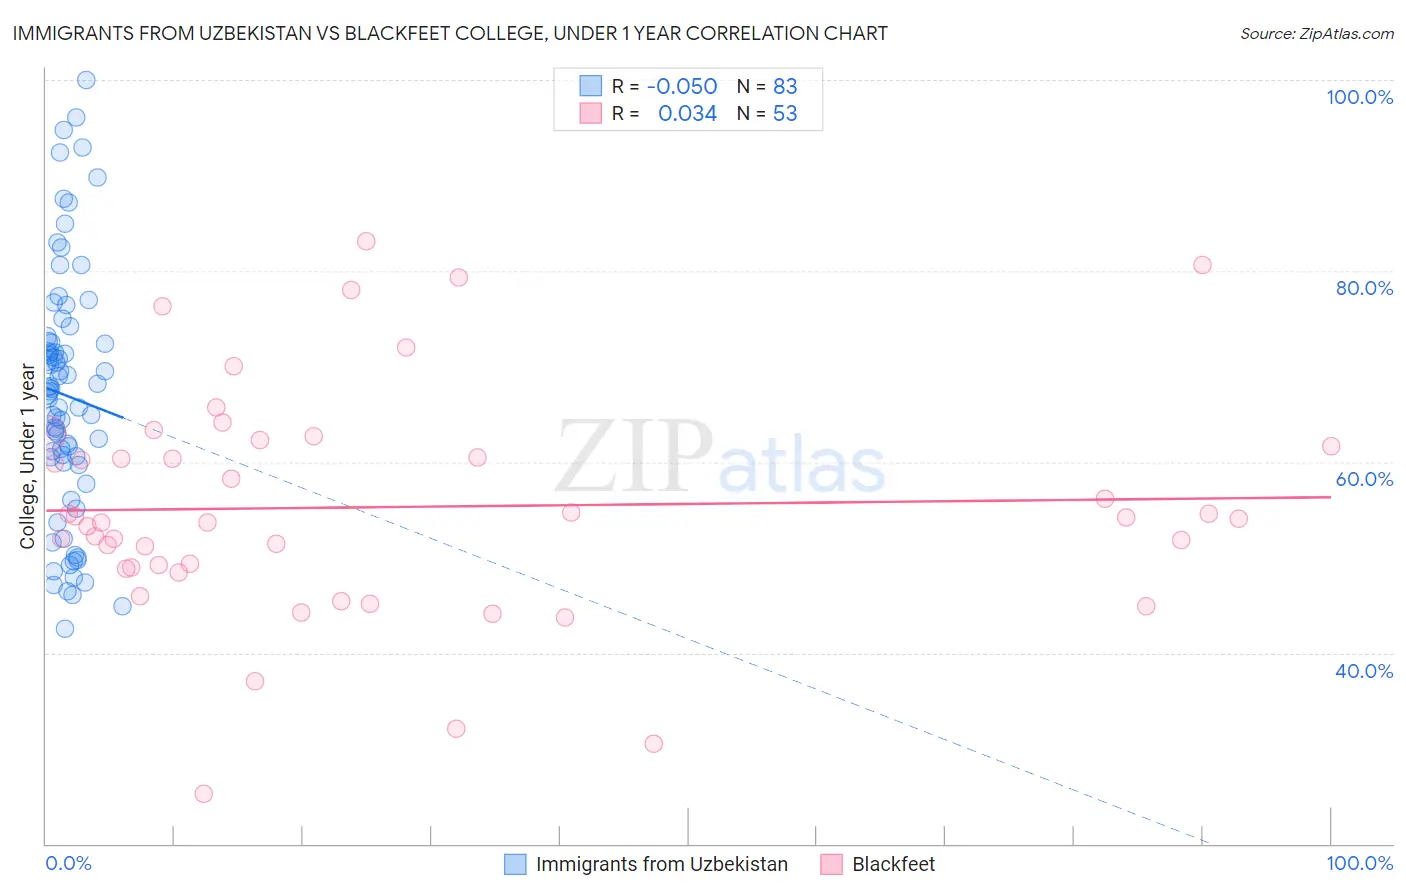
Immigrants from Uzbekistan vs Blackfeet College, Under 1 year Correlation Chart
The statistical analysis conducted on geographies consisting of 118,765,305 people shows no correlation between the proportion of Immigrants from Uzbekistan and percentage of population with at least college, under 1 year education in the United States with a correlation coefficient (R) of -0.050 and weighted average of 65.8%. Similarly, the statistical analysis conducted on geographies consisting of 309,581,838 people shows no correlation between the proportion of Blackfeet and percentage of population with at least college, under 1 year education in the United States with a correlation coefficient (R) of 0.034 and weighted average of 61.1%, a difference of 7.5%.
College, Under 1 year Correlation Summary
| Measurement | Immigrants from Uzbekistan | Blackfeet |
| Minimum | 42.6% | 25.2% |
| Maximum | 100.0% | 83.1% |
| Range | 57.4% | 57.8% |
| Mean | 67.0% | 55.3% |
| Median | 67.4% | 54.0% |
| Interquartile 25% (IQ1) | 59.9% | 48.9% |
| Interquartile 75% (IQ3) | 72.6% | 62.0% |
| Interquartile Range (IQR) | 12.7% | 13.1% |
| Standard Deviation (Sample) | 12.9% | 12.0% |
| Standard Deviation (Population) | 12.9% | 11.9% |
Similar Demographics by College, Under 1 year
Demographics Similar to Immigrants from Uzbekistan by College, Under 1 year
In terms of college, under 1 year, the demographic groups most similar to Immigrants from Uzbekistan are Somali (65.8%, a difference of 0.050%), Czechoslovakian (65.8%, a difference of 0.050%), Korean (65.9%, a difference of 0.17%), Brazilian (65.9%, a difference of 0.21%), and Albanian (65.9%, a difference of 0.22%).
| Demographics | Rating | Rank | College, Under 1 year |
| Celtics | 67.3 /100 | #158 | Good 65.9% |
| Tlingit-Haida | 66.4 /100 | #159 | Good 65.9% |
| Albanians | 66.1 /100 | #160 | Good 65.9% |
| Brazilians | 66.0 /100 | #161 | Good 65.9% |
| Koreans | 65.3 /100 | #162 | Good 65.9% |
| Somalis | 62.7 /100 | #163 | Good 65.8% |
| Czechoslovakians | 62.6 /100 | #164 | Good 65.8% |
| Immigrants | Uzbekistan | 61.6 /100 | #165 | Good 65.8% |
| Moroccans | 56.7 /100 | #166 | Average 65.6% |
| Immigrants | Somalia | 56.4 /100 | #167 | Average 65.6% |
| Hungarians | 55.9 /100 | #168 | Average 65.6% |
| Yugoslavians | 55.7 /100 | #169 | Average 65.6% |
| Germans | 55.7 /100 | #170 | Average 65.6% |
| Immigrants | Oceania | 55.0 /100 | #171 | Average 65.6% |
| South American Indians | 54.4 /100 | #172 | Average 65.5% |
Demographics Similar to Blackfeet by College, Under 1 year
In terms of college, under 1 year, the demographic groups most similar to Blackfeet are African (61.1%, a difference of 0.030%), Barbadian (61.1%, a difference of 0.070%), Shoshone (61.1%, a difference of 0.070%), Trinidadian and Tobagonian (61.1%, a difference of 0.13%), and Immigrants from Bahamas (61.1%, a difference of 0.13%).
| Demographics | Rating | Rank | College, Under 1 year |
| Japanese | 0.4 /100 | #253 | Tragic 61.5% |
| Immigrants | Cambodia | 0.4 /100 | #254 | Tragic 61.5% |
| Comanche | 0.4 /100 | #255 | Tragic 61.4% |
| Bangladeshis | 0.4 /100 | #256 | Tragic 61.4% |
| Immigrants | Laos | 0.3 /100 | #257 | Tragic 61.3% |
| Immigrants | Bangladesh | 0.3 /100 | #258 | Tragic 61.3% |
| Indonesians | 0.3 /100 | #259 | Tragic 61.2% |
| Blackfeet | 0.3 /100 | #260 | Tragic 61.1% |
| Africans | 0.3 /100 | #261 | Tragic 61.1% |
| Barbadians | 0.2 /100 | #262 | Tragic 61.1% |
| Shoshone | 0.2 /100 | #263 | Tragic 61.1% |
| Trinidadians and Tobagonians | 0.2 /100 | #264 | Tragic 61.1% |
| Immigrants | Bahamas | 0.2 /100 | #265 | Tragic 61.1% |
| Alaskan Athabascans | 0.2 /100 | #266 | Tragic 61.0% |
| Americans | 0.2 /100 | #267 | Tragic 61.0% |