Immigrants from Uzbekistan vs Honduran College, Under 1 year
COMPARE
Immigrants from Uzbekistan
Honduran
College, Under 1 year
College, Under 1 year Comparison
Immigrants from Uzbekistan
Hondurans
65.8%
COLLEGE, UNDER 1 YEAR
61.6/ 100
METRIC RATING
165th/ 347
METRIC RANK
57.1%
COLLEGE, UNDER 1 YEAR
0.0/ 100
METRIC RATING
315th/ 347
METRIC RANK
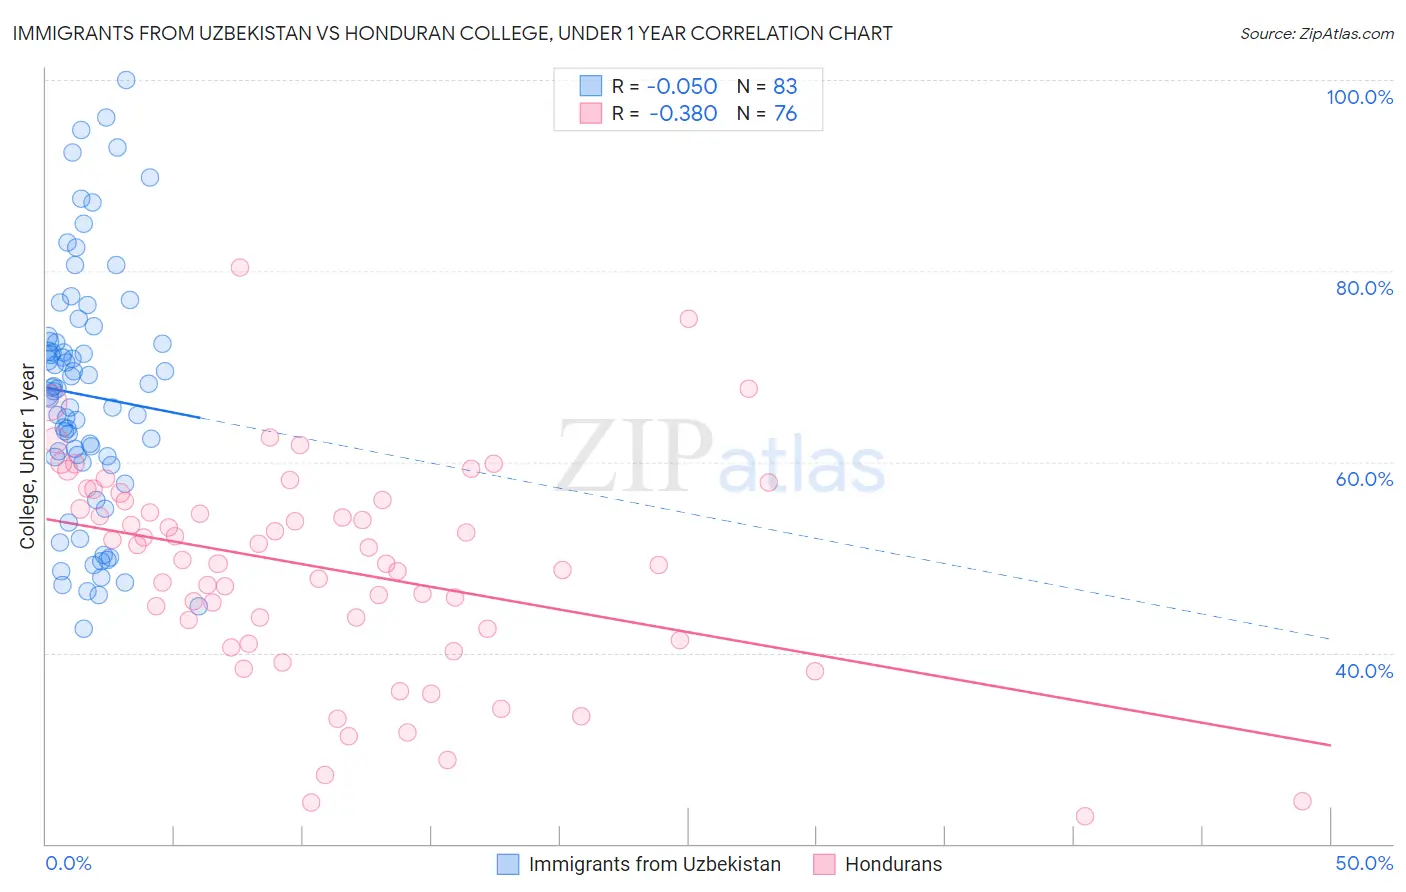
Immigrants from Uzbekistan vs Honduran College, Under 1 year Correlation Chart
The statistical analysis conducted on geographies consisting of 118,765,305 people shows no correlation between the proportion of Immigrants from Uzbekistan and percentage of population with at least college, under 1 year education in the United States with a correlation coefficient (R) of -0.050 and weighted average of 65.8%. Similarly, the statistical analysis conducted on geographies consisting of 357,856,249 people shows a mild negative correlation between the proportion of Hondurans and percentage of population with at least college, under 1 year education in the United States with a correlation coefficient (R) of -0.380 and weighted average of 57.1%, a difference of 15.2%.
College, Under 1 year Correlation Summary
| Measurement | Immigrants from Uzbekistan | Honduran |
| Minimum | 42.6% | 22.9% |
| Maximum | 100.0% | 80.4% |
| Range | 57.4% | 57.4% |
| Mean | 67.0% | 48.8% |
| Median | 67.4% | 49.5% |
| Interquartile 25% (IQ1) | 59.9% | 41.9% |
| Interquartile 75% (IQ3) | 72.6% | 55.9% |
| Interquartile Range (IQR) | 12.7% | 14.0% |
| Standard Deviation (Sample) | 12.9% | 11.3% |
| Standard Deviation (Population) | 12.9% | 11.2% |
Similar Demographics by College, Under 1 year
Demographics Similar to Immigrants from Uzbekistan by College, Under 1 year
In terms of college, under 1 year, the demographic groups most similar to Immigrants from Uzbekistan are Somali (65.8%, a difference of 0.050%), Czechoslovakian (65.8%, a difference of 0.050%), Korean (65.9%, a difference of 0.17%), Brazilian (65.9%, a difference of 0.21%), and Albanian (65.9%, a difference of 0.22%).
| Demographics | Rating | Rank | College, Under 1 year |
| Celtics | 67.3 /100 | #158 | Good 65.9% |
| Tlingit-Haida | 66.4 /100 | #159 | Good 65.9% |
| Albanians | 66.1 /100 | #160 | Good 65.9% |
| Brazilians | 66.0 /100 | #161 | Good 65.9% |
| Koreans | 65.3 /100 | #162 | Good 65.9% |
| Somalis | 62.7 /100 | #163 | Good 65.8% |
| Czechoslovakians | 62.6 /100 | #164 | Good 65.8% |
| Immigrants | Uzbekistan | 61.6 /100 | #165 | Good 65.8% |
| Moroccans | 56.7 /100 | #166 | Average 65.6% |
| Immigrants | Somalia | 56.4 /100 | #167 | Average 65.6% |
| Hungarians | 55.9 /100 | #168 | Average 65.6% |
| Yugoslavians | 55.7 /100 | #169 | Average 65.6% |
| Germans | 55.7 /100 | #170 | Average 65.6% |
| Immigrants | Oceania | 55.0 /100 | #171 | Average 65.6% |
| South American Indians | 54.4 /100 | #172 | Average 65.5% |
Demographics Similar to Hondurans by College, Under 1 year
In terms of college, under 1 year, the demographic groups most similar to Hondurans are Hopi (57.1%, a difference of 0.040%), Menominee (57.0%, a difference of 0.050%), Hispanic or Latino (57.0%, a difference of 0.090%), Dutch West Indian (57.2%, a difference of 0.16%), and Immigrants from Haiti (56.9%, a difference of 0.21%).
| Demographics | Rating | Rank | College, Under 1 year |
| Central Americans | 0.0 /100 | #308 | Tragic 57.7% |
| Immigrants | Nicaragua | 0.0 /100 | #309 | Tragic 57.6% |
| Pueblo | 0.0 /100 | #310 | Tragic 57.4% |
| Cajuns | 0.0 /100 | #311 | Tragic 57.3% |
| Salvadorans | 0.0 /100 | #312 | Tragic 57.3% |
| Dutch West Indians | 0.0 /100 | #313 | Tragic 57.2% |
| Hopi | 0.0 /100 | #314 | Tragic 57.1% |
| Hondurans | 0.0 /100 | #315 | Tragic 57.1% |
| Menominee | 0.0 /100 | #316 | Tragic 57.0% |
| Hispanics or Latinos | 0.0 /100 | #317 | Tragic 57.0% |
| Immigrants | Haiti | 0.0 /100 | #318 | Tragic 56.9% |
| Puerto Ricans | 0.0 /100 | #319 | Tragic 56.8% |
| Guatemalans | 0.0 /100 | #320 | Tragic 56.8% |
| Natives/Alaskans | 0.0 /100 | #321 | Tragic 56.6% |
| Immigrants | Caribbean | 0.0 /100 | #322 | Tragic 56.6% |