Immigrants from Uzbekistan vs Immigrants from Canada In Labor Force | Age 16-19
COMPARE
Immigrants from Uzbekistan
Immigrants from Canada
In Labor Force | Age 16-19
In Labor Force | Age 16-19 Comparison
Immigrants from Uzbekistan
Immigrants from Canada
29.2%
IN LABOR FORCE | AGE 16-19
0.0/ 100
METRIC RATING
339th/ 347
METRIC RANK
38.9%
IN LABOR FORCE | AGE 16-19
99.4/ 100
METRIC RATING
94th/ 347
METRIC RANK
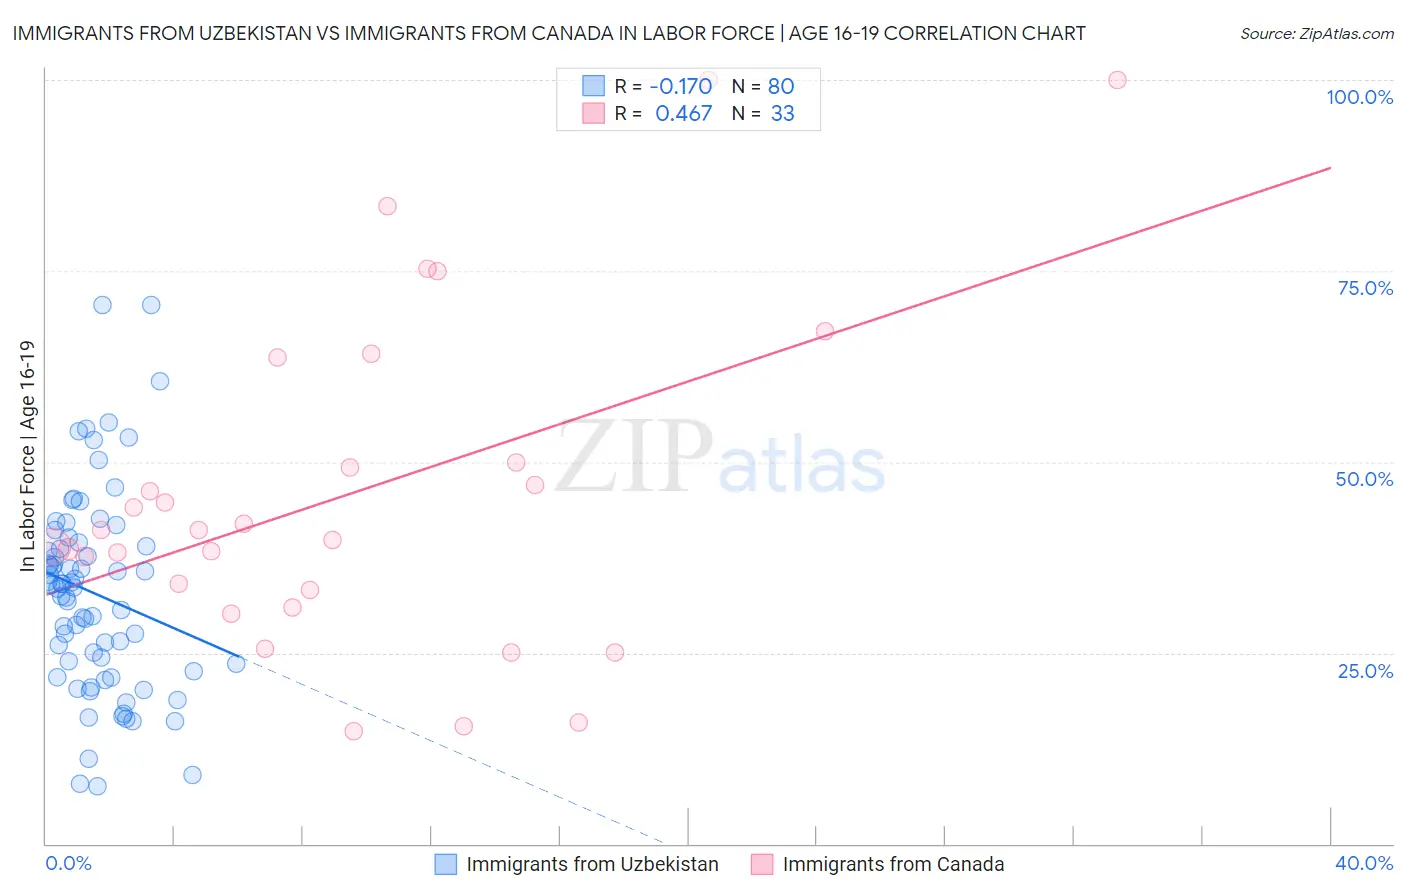
Immigrants from Uzbekistan vs Immigrants from Canada In Labor Force | Age 16-19 Correlation Chart
The statistical analysis conducted on geographies consisting of 118,707,763 people shows a poor negative correlation between the proportion of Immigrants from Uzbekistan and labor force participation rate among population between the ages 16 and 19 in the United States with a correlation coefficient (R) of -0.170 and weighted average of 29.2%. Similarly, the statistical analysis conducted on geographies consisting of 458,098,188 people shows a moderate positive correlation between the proportion of Immigrants from Canada and labor force participation rate among population between the ages 16 and 19 in the United States with a correlation coefficient (R) of 0.467 and weighted average of 38.9%, a difference of 33.5%.
In Labor Force | Age 16-19 Correlation Summary
| Measurement | Immigrants from Uzbekistan | Immigrants from Canada |
| Minimum | 7.6% | 14.7% |
| Maximum | 70.6% | 100.0% |
| Range | 63.0% | 85.3% |
| Mean | 32.8% | 45.9% |
| Median | 33.7% | 41.0% |
| Interquartile 25% (IQ1) | 23.1% | 32.1% |
| Interquartile 75% (IQ3) | 39.2% | 56.8% |
| Interquartile Range (IQR) | 16.1% | 24.7% |
| Standard Deviation (Sample) | 13.1% | 21.9% |
| Standard Deviation (Population) | 13.0% | 21.6% |
Similar Demographics by In Labor Force | Age 16-19
Demographics Similar to Immigrants from Uzbekistan by In Labor Force | Age 16-19
In terms of in labor force | age 16-19, the demographic groups most similar to Immigrants from Uzbekistan are British West Indian (29.1%, a difference of 0.20%), Immigrants from Armenia (29.0%, a difference of 0.43%), Immigrants from Barbados (29.0%, a difference of 0.58%), Vietnamese (29.6%, a difference of 1.4%), and Immigrants from Bangladesh (30.0%, a difference of 3.1%).
| Demographics | Rating | Rank | In Labor Force | Age 16-19 |
| Immigrants | Israel | 0.0 /100 | #332 | Tragic 30.5% |
| Immigrants | Hong Kong | 0.0 /100 | #333 | Tragic 30.5% |
| Puerto Ricans | 0.0 /100 | #334 | Tragic 30.3% |
| Immigrants | Cuba | 0.0 /100 | #335 | Tragic 30.2% |
| Immigrants | Trinidad and Tobago | 0.0 /100 | #336 | Tragic 30.2% |
| Immigrants | Bangladesh | 0.0 /100 | #337 | Tragic 30.0% |
| Vietnamese | 0.0 /100 | #338 | Tragic 29.6% |
| Immigrants | Uzbekistan | 0.0 /100 | #339 | Tragic 29.2% |
| British West Indians | 0.0 /100 | #340 | Tragic 29.1% |
| Immigrants | Armenia | 0.0 /100 | #341 | Tragic 29.0% |
| Immigrants | Barbados | 0.0 /100 | #342 | Tragic 29.0% |
| Yuman | 0.0 /100 | #343 | Tragic 27.7% |
| Guyanese | 0.0 /100 | #344 | Tragic 27.4% |
| Immigrants | Guyana | 0.0 /100 | #345 | Tragic 27.3% |
| Immigrants | St. Vincent and the Grenadines | 0.0 /100 | #346 | Tragic 26.3% |
Demographics Similar to Immigrants from Canada by In Labor Force | Age 16-19
In terms of in labor force | age 16-19, the demographic groups most similar to Immigrants from Canada are Blackfeet (38.9%, a difference of 0.010%), Osage (39.0%, a difference of 0.060%), Immigrants from North America (38.9%, a difference of 0.090%), Latvian (38.9%, a difference of 0.12%), and Spanish American (39.0%, a difference of 0.15%).
| Demographics | Rating | Rank | In Labor Force | Age 16-19 |
| Immigrants | Germany | 99.6 /100 | #87 | Exceptional 39.1% |
| Puget Sound Salish | 99.6 /100 | #88 | Exceptional 39.1% |
| Alaska Natives | 99.6 /100 | #89 | Exceptional 39.1% |
| Immigrants | Burma/Myanmar | 99.5 /100 | #90 | Exceptional 39.0% |
| Spanish Americans | 99.5 /100 | #91 | Exceptional 39.0% |
| Osage | 99.4 /100 | #92 | Exceptional 39.0% |
| Blackfeet | 99.4 /100 | #93 | Exceptional 38.9% |
| Immigrants | Canada | 99.4 /100 | #94 | Exceptional 38.9% |
| Immigrants | North America | 99.4 /100 | #95 | Exceptional 38.9% |
| Latvians | 99.4 /100 | #96 | Exceptional 38.9% |
| Greeks | 99.3 /100 | #97 | Exceptional 38.9% |
| Ugandans | 99.3 /100 | #98 | Exceptional 38.9% |
| Immigrants | North Macedonia | 99.3 /100 | #99 | Exceptional 38.9% |
| Immigrants | Thailand | 99.1 /100 | #100 | Exceptional 38.7% |
| Hmong | 99.1 /100 | #101 | Exceptional 38.7% |