Immigrants from Thailand vs Immigrants from Latin America Householder Income Ages 45 - 64 years
COMPARE
Immigrants from Thailand
Immigrants from Latin America
Householder Income Ages 45 - 64 years
Householder Income Ages 45 - 64 years Comparison
Immigrants from Thailand
Immigrants from Latin America
$97,400
HOUSEHOLDER INCOME AGES 45 - 64 YEARS
18.8/ 100
METRIC RATING
203rd/ 347
METRIC RANK
$87,219
HOUSEHOLDER INCOME AGES 45 - 64 YEARS
0.1/ 100
METRIC RATING
276th/ 347
METRIC RANK
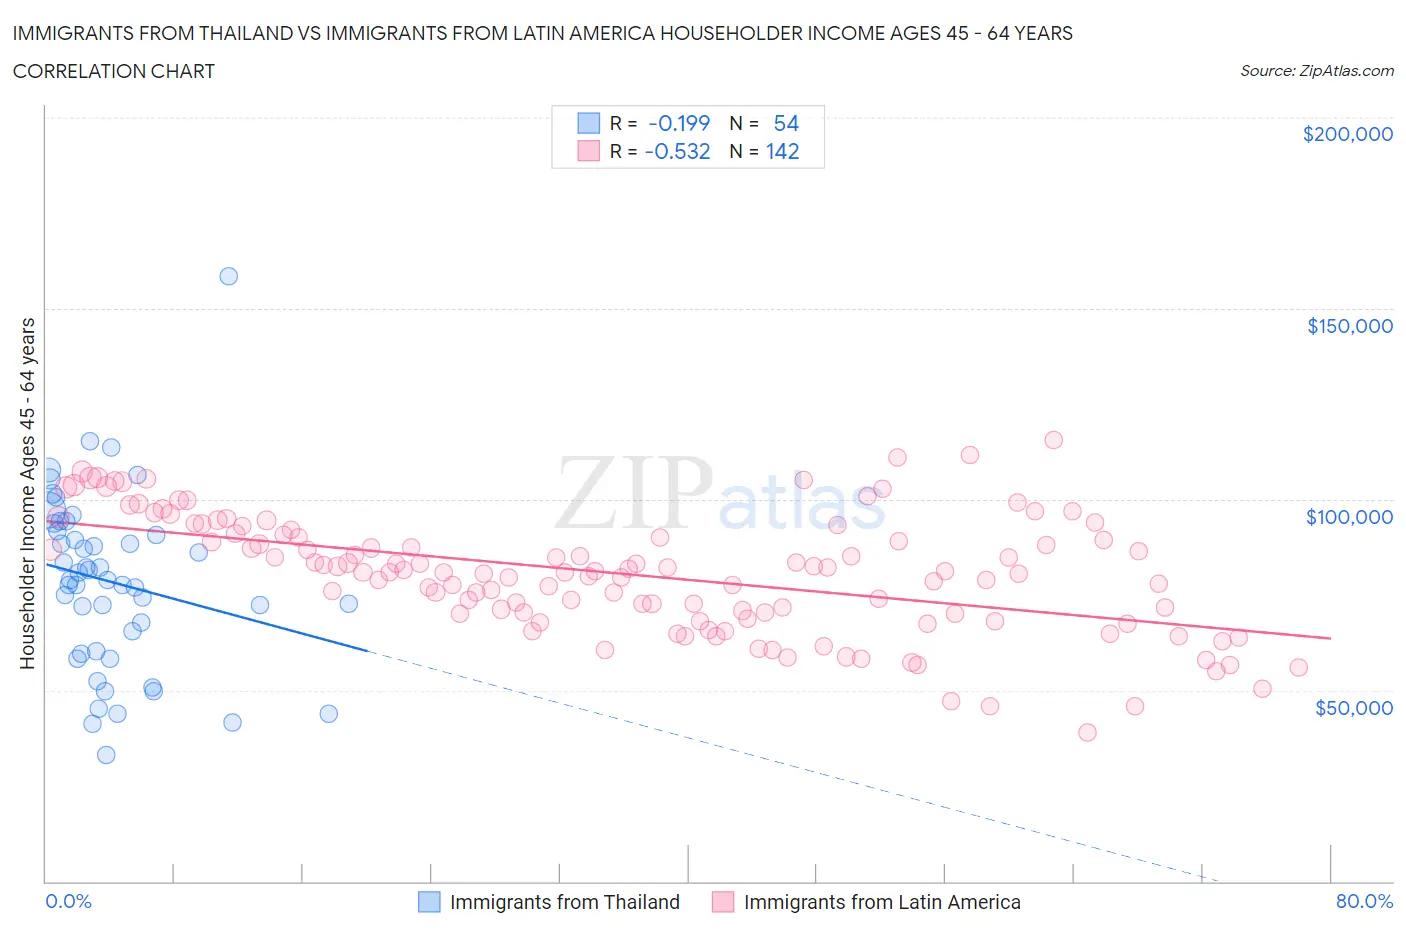
Immigrants from Thailand vs Immigrants from Latin America Householder Income Ages 45 - 64 years Correlation Chart
The statistical analysis conducted on geographies consisting of 316,747,183 people shows a poor negative correlation between the proportion of Immigrants from Thailand and household income with householder between the ages 45 and 64 in the United States with a correlation coefficient (R) of -0.199 and weighted average of $97,400. Similarly, the statistical analysis conducted on geographies consisting of 555,418,501 people shows a substantial negative correlation between the proportion of Immigrants from Latin America and household income with householder between the ages 45 and 64 in the United States with a correlation coefficient (R) of -0.532 and weighted average of $87,219, a difference of 11.7%.
Householder Income Ages 45 - 64 years Correlation Summary
| Measurement | Immigrants from Thailand | Immigrants from Latin America |
| Minimum | $32,910 | $38,838 |
| Maximum | $158,417 | $115,549 |
| Range | $125,507 | $76,711 |
| Mean | $78,332 | $80,477 |
| Median | $78,883 | $81,005 |
| Interquartile 25% (IQ1) | $60,388 | $70,093 |
| Interquartile 75% (IQ3) | $91,575 | $90,998 |
| Interquartile Range (IQR) | $31,186 | $20,906 |
| Standard Deviation (Sample) | $23,014 | $15,402 |
| Standard Deviation (Population) | $22,800 | $15,348 |
Similar Demographics by Householder Income Ages 45 - 64 years
Demographics Similar to Immigrants from Thailand by Householder Income Ages 45 - 64 years
In terms of householder income ages 45 - 64 years, the demographic groups most similar to Immigrants from Thailand are Tlingit-Haida ($97,417, a difference of 0.020%), Immigrants from Eritrea ($97,373, a difference of 0.030%), Immigrants from Colombia ($97,290, a difference of 0.11%), Immigrants from Africa ($97,284, a difference of 0.12%), and Ghanaian ($97,277, a difference of 0.13%).
| Demographics | Rating | Rank | Householder Income Ages 45 - 64 years |
| Immigrants | Eastern Africa | 28.3 /100 | #196 | Fair $98,467 |
| Puget Sound Salish | 27.0 /100 | #197 | Fair $98,340 |
| Immigrants | Iraq | 25.7 /100 | #198 | Fair $98,201 |
| Whites/Caucasians | 24.6 /100 | #199 | Fair $98,091 |
| Immigrants | Kenya | 23.5 /100 | #200 | Fair $97,964 |
| Yugoslavians | 20.0 /100 | #201 | Fair $97,558 |
| Tlingit-Haida | 18.9 /100 | #202 | Poor $97,417 |
| Immigrants | Thailand | 18.8 /100 | #203 | Poor $97,400 |
| Immigrants | Eritrea | 18.6 /100 | #204 | Poor $97,373 |
| Immigrants | Colombia | 18.0 /100 | #205 | Poor $97,290 |
| Immigrants | Africa | 17.9 /100 | #206 | Poor $97,284 |
| Ghanaians | 17.9 /100 | #207 | Poor $97,277 |
| Scotch-Irish | 16.4 /100 | #208 | Poor $97,073 |
| Japanese | 14.8 /100 | #209 | Poor $96,834 |
| Tsimshian | 14.5 /100 | #210 | Poor $96,783 |
Demographics Similar to Immigrants from Latin America by Householder Income Ages 45 - 64 years
In terms of householder income ages 45 - 64 years, the demographic groups most similar to Immigrants from Latin America are Immigrants from Belize ($87,229, a difference of 0.010%), Iroquois ($87,255, a difference of 0.040%), Cree ($87,185, a difference of 0.040%), Immigrants from Jamaica ($87,035, a difference of 0.21%), and Yakama ($86,992, a difference of 0.26%).
| Demographics | Rating | Rank | Householder Income Ages 45 - 64 years |
| Spanish Americans | 0.2 /100 | #269 | Tragic $87,836 |
| Immigrants | Liberia | 0.2 /100 | #270 | Tragic $87,739 |
| Guatemalans | 0.2 /100 | #271 | Tragic $87,705 |
| Cape Verdeans | 0.2 /100 | #272 | Tragic $87,580 |
| Spanish American Indians | 0.2 /100 | #273 | Tragic $87,561 |
| Iroquois | 0.1 /100 | #274 | Tragic $87,255 |
| Immigrants | Belize | 0.1 /100 | #275 | Tragic $87,229 |
| Immigrants | Latin America | 0.1 /100 | #276 | Tragic $87,219 |
| Cree | 0.1 /100 | #277 | Tragic $87,185 |
| Immigrants | Jamaica | 0.1 /100 | #278 | Tragic $87,035 |
| Yakama | 0.1 /100 | #279 | Tragic $86,992 |
| Immigrants | Somalia | 0.1 /100 | #280 | Tragic $86,987 |
| Yaqui | 0.1 /100 | #281 | Tragic $86,914 |
| Senegalese | 0.1 /100 | #282 | Tragic $86,897 |
| Mexicans | 0.1 /100 | #283 | Tragic $86,816 |