Immigrants from Thailand vs Arapaho GED/Equivalency
COMPARE
Immigrants from Thailand
Arapaho
GED/Equivalency
GED/Equivalency Comparison
Immigrants from Thailand
Arapaho
84.5%
GED/EQUIVALENCY
5.8/ 100
METRIC RATING
225th/ 347
METRIC RANK
82.8%
GED/EQUIVALENCY
0.1/ 100
METRIC RATING
277th/ 347
METRIC RANK
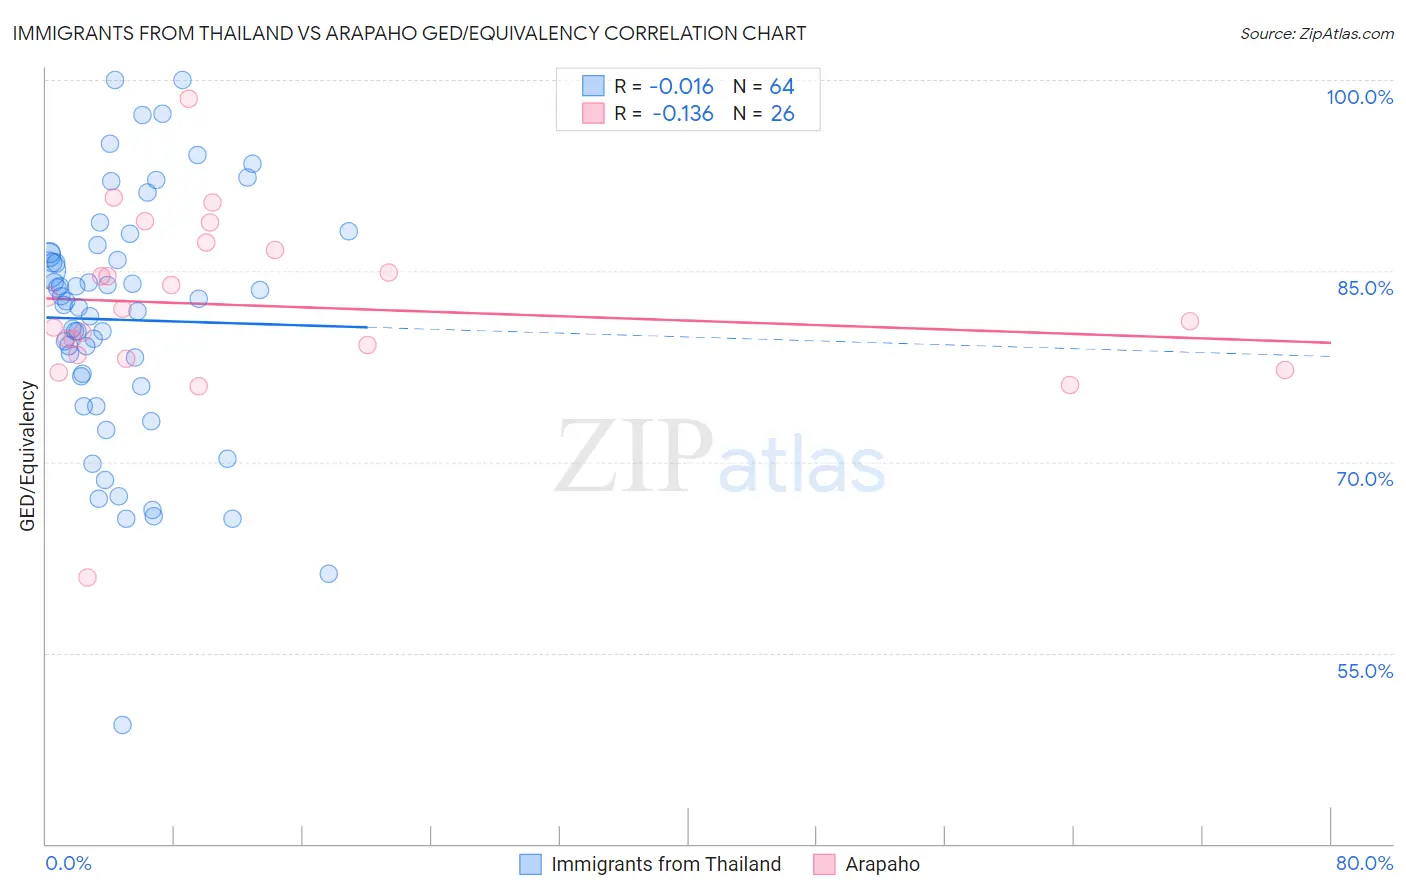
Immigrants from Thailand vs Arapaho GED/Equivalency Correlation Chart
The statistical analysis conducted on geographies consisting of 317,022,868 people shows no correlation between the proportion of Immigrants from Thailand and percentage of population with at least ged/equivalency education in the United States with a correlation coefficient (R) of -0.016 and weighted average of 84.5%. Similarly, the statistical analysis conducted on geographies consisting of 29,780,040 people shows a poor negative correlation between the proportion of Arapaho and percentage of population with at least ged/equivalency education in the United States with a correlation coefficient (R) of -0.136 and weighted average of 82.8%, a difference of 2.1%.
GED/Equivalency Correlation Summary
| Measurement | Immigrants from Thailand | Arapaho |
| Minimum | 49.4% | 60.9% |
| Maximum | 100.0% | 98.5% |
| Range | 50.6% | 37.6% |
| Mean | 81.2% | 82.2% |
| Median | 82.5% | 81.5% |
| Interquartile 25% (IQ1) | 76.4% | 78.4% |
| Interquartile 75% (IQ3) | 86.3% | 86.6% |
| Interquartile Range (IQR) | 10.0% | 8.2% |
| Standard Deviation (Sample) | 9.8% | 6.9% |
| Standard Deviation (Population) | 9.7% | 6.8% |
Similar Demographics by GED/Equivalency
Demographics Similar to Immigrants from Thailand by GED/Equivalency
In terms of ged/equivalency, the demographic groups most similar to Immigrants from Thailand are Immigrants from Zaire (84.5%, a difference of 0.020%), Immigrants from Costa Rica (84.5%, a difference of 0.040%), French American Indian (84.6%, a difference of 0.050%), Immigrants from Liberia (84.4%, a difference of 0.090%), and Immigrants from Uzbekistan (84.6%, a difference of 0.12%).
| Demographics | Rating | Rank | GED/Equivalency |
| Alaska Natives | 8.6 /100 | #218 | Tragic 84.7% |
| Potawatomi | 8.2 /100 | #219 | Tragic 84.7% |
| Americans | 8.2 /100 | #220 | Tragic 84.7% |
| Taiwanese | 8.1 /100 | #221 | Tragic 84.7% |
| Iroquois | 7.5 /100 | #222 | Tragic 84.6% |
| Immigrants | Uzbekistan | 7.1 /100 | #223 | Tragic 84.6% |
| French American Indians | 6.3 /100 | #224 | Tragic 84.6% |
| Immigrants | Thailand | 5.8 /100 | #225 | Tragic 84.5% |
| Immigrants | Zaire | 5.5 /100 | #226 | Tragic 84.5% |
| Immigrants | Costa Rica | 5.4 /100 | #227 | Tragic 84.5% |
| Immigrants | Liberia | 4.9 /100 | #228 | Tragic 84.4% |
| Immigrants | Uruguay | 4.6 /100 | #229 | Tragic 84.4% |
| Immigrants | Colombia | 4.5 /100 | #230 | Tragic 84.4% |
| Immigrants | Middle Africa | 4.3 /100 | #231 | Tragic 84.4% |
| Immigrants | South America | 4.2 /100 | #232 | Tragic 84.4% |
Demographics Similar to Arapaho by GED/Equivalency
In terms of ged/equivalency, the demographic groups most similar to Arapaho are Black/African American (82.8%, a difference of 0.020%), Immigrants from Laos (82.7%, a difference of 0.030%), Seminole (82.8%, a difference of 0.040%), Immigrants from Fiji (82.7%, a difference of 0.040%), and Cheyenne (82.7%, a difference of 0.050%).
| Demographics | Rating | Rank | GED/Equivalency |
| Immigrants | Jamaica | 0.2 /100 | #270 | Tragic 82.9% |
| U.S. Virgin Islanders | 0.2 /100 | #271 | Tragic 82.9% |
| Barbadians | 0.1 /100 | #272 | Tragic 82.9% |
| Pennsylvania Germans | 0.1 /100 | #273 | Tragic 82.9% |
| Immigrants | Trinidad and Tobago | 0.1 /100 | #274 | Tragic 82.8% |
| Seminole | 0.1 /100 | #275 | Tragic 82.8% |
| Blacks/African Americans | 0.1 /100 | #276 | Tragic 82.8% |
| Arapaho | 0.1 /100 | #277 | Tragic 82.8% |
| Immigrants | Laos | 0.1 /100 | #278 | Tragic 82.7% |
| Immigrants | Fiji | 0.1 /100 | #279 | Tragic 82.7% |
| Cheyenne | 0.1 /100 | #280 | Tragic 82.7% |
| Sioux | 0.1 /100 | #281 | Tragic 82.6% |
| Immigrants | Immigrants | 0.1 /100 | #282 | Tragic 82.6% |
| Indonesians | 0.1 /100 | #283 | Tragic 82.5% |
| Immigrants | Barbados | 0.1 /100 | #284 | Tragic 82.4% |