Immigrants from Thailand vs Liberian GED/Equivalency
COMPARE
Immigrants from Thailand
Liberian
GED/Equivalency
GED/Equivalency Comparison
Immigrants from Thailand
Liberians
84.5%
GED/EQUIVALENCY
5.8/ 100
METRIC RATING
225th/ 347
METRIC RANK
85.0%
GED/EQUIVALENCY
14.6/ 100
METRIC RATING
205th/ 347
METRIC RANK
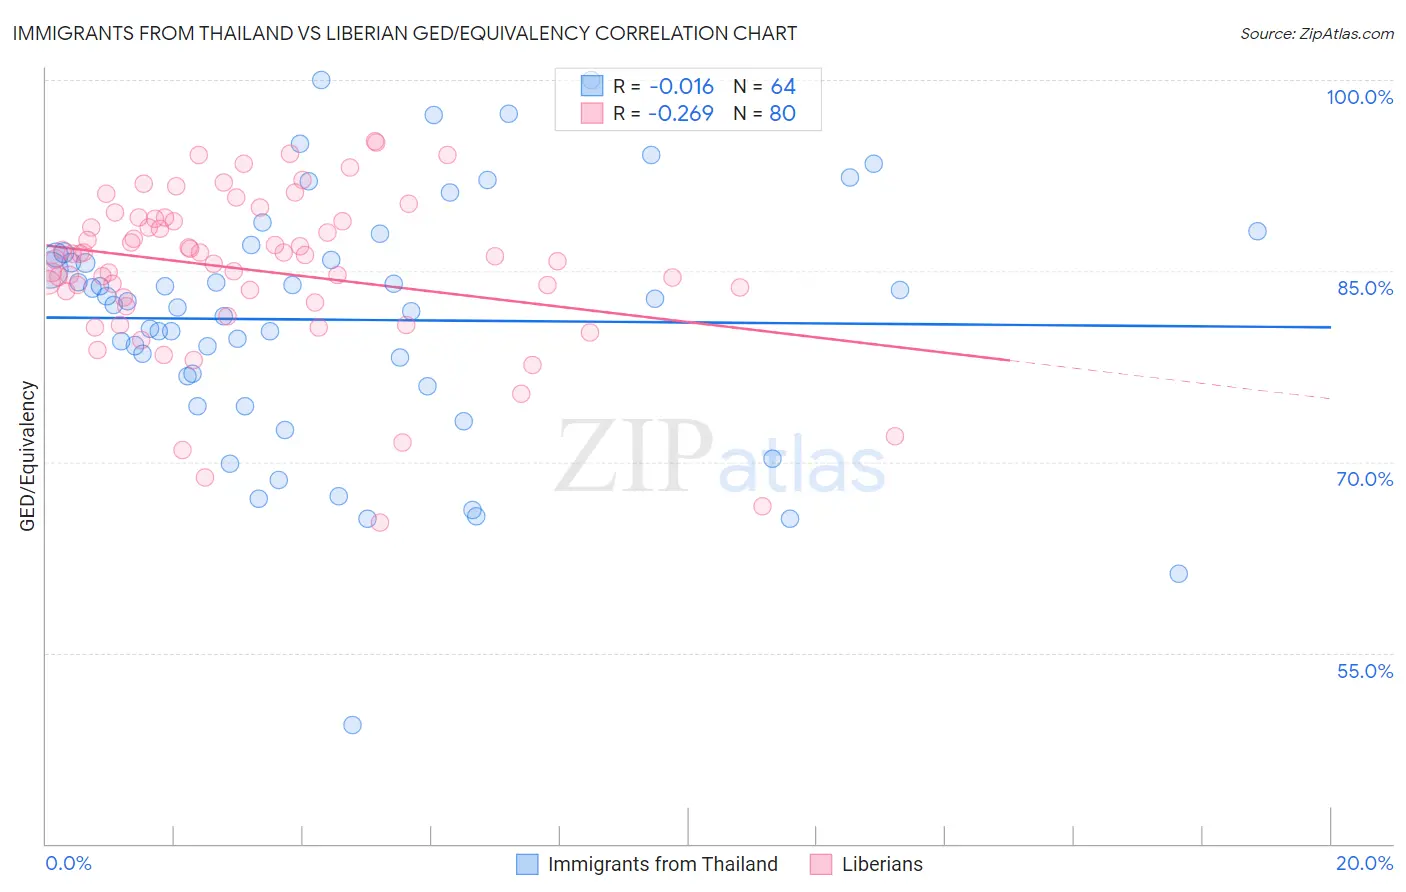
Immigrants from Thailand vs Liberian GED/Equivalency Correlation Chart
The statistical analysis conducted on geographies consisting of 317,022,868 people shows no correlation between the proportion of Immigrants from Thailand and percentage of population with at least ged/equivalency education in the United States with a correlation coefficient (R) of -0.016 and weighted average of 84.5%. Similarly, the statistical analysis conducted on geographies consisting of 118,103,458 people shows a weak negative correlation between the proportion of Liberians and percentage of population with at least ged/equivalency education in the United States with a correlation coefficient (R) of -0.269 and weighted average of 85.0%, a difference of 0.53%.
GED/Equivalency Correlation Summary
| Measurement | Immigrants from Thailand | Liberian |
| Minimum | 49.4% | 65.2% |
| Maximum | 100.0% | 95.2% |
| Range | 50.6% | 29.9% |
| Mean | 81.2% | 85.1% |
| Median | 82.5% | 86.2% |
| Interquartile 25% (IQ1) | 76.4% | 82.7% |
| Interquartile 75% (IQ3) | 86.3% | 89.0% |
| Interquartile Range (IQR) | 10.0% | 6.3% |
| Standard Deviation (Sample) | 9.8% | 6.3% |
| Standard Deviation (Population) | 9.7% | 6.3% |
Demographics Similar to Immigrants from Thailand and Liberians by GED/Equivalency
In terms of ged/equivalency, the demographic groups most similar to Immigrants from Thailand are French American Indian (84.6%, a difference of 0.050%), Immigrants from Uzbekistan (84.6%, a difference of 0.12%), Iroquois (84.6%, a difference of 0.15%), Taiwanese (84.7%, a difference of 0.19%), and Potawatomi (84.7%, a difference of 0.20%). Similarly, the demographic groups most similar to Liberians are Samoan (84.9%, a difference of 0.040%), Hmong (84.9%, a difference of 0.060%), Marshallese (84.9%, a difference of 0.090%), Colombian (84.9%, a difference of 0.10%), and Immigrants from Cameroon (84.9%, a difference of 0.11%).
| Demographics | Rating | Rank | GED/Equivalency |
| Liberians | 14.6 /100 | #205 | Poor 85.0% |
| Samoans | 13.7 /100 | #206 | Poor 84.9% |
| Hmong | 13.1 /100 | #207 | Poor 84.9% |
| Marshallese | 12.5 /100 | #208 | Poor 84.9% |
| Colombians | 12.3 /100 | #209 | Poor 84.9% |
| Immigrants | Cameroon | 12.1 /100 | #210 | Poor 84.9% |
| South Americans | 10.9 /100 | #211 | Poor 84.8% |
| Immigrants | Somalia | 10.6 /100 | #212 | Poor 84.8% |
| Immigrants | Philippines | 10.0 /100 | #213 | Poor 84.8% |
| Osage | 9.5 /100 | #214 | Tragic 84.8% |
| Peruvians | 9.2 /100 | #215 | Tragic 84.7% |
| Immigrants | Micronesia | 8.7 /100 | #216 | Tragic 84.7% |
| Nigerians | 8.6 /100 | #217 | Tragic 84.7% |
| Alaska Natives | 8.6 /100 | #218 | Tragic 84.7% |
| Potawatomi | 8.2 /100 | #219 | Tragic 84.7% |
| Americans | 8.2 /100 | #220 | Tragic 84.7% |
| Taiwanese | 8.1 /100 | #221 | Tragic 84.7% |
| Iroquois | 7.5 /100 | #222 | Tragic 84.6% |
| Immigrants | Uzbekistan | 7.1 /100 | #223 | Tragic 84.6% |
| French American Indians | 6.3 /100 | #224 | Tragic 84.6% |
| Immigrants | Thailand | 5.8 /100 | #225 | Tragic 84.5% |