Immigrants from Syria vs Burmese GED/Equivalency
COMPARE
Immigrants from Syria
Burmese
GED/Equivalency
GED/Equivalency Comparison
Immigrants from Syria
Burmese
86.1%
GED/EQUIVALENCY
69.3/ 100
METRIC RATING
161st/ 347
METRIC RANK
88.3%
GED/EQUIVALENCY
99.7/ 100
METRIC RATING
38th/ 347
METRIC RANK
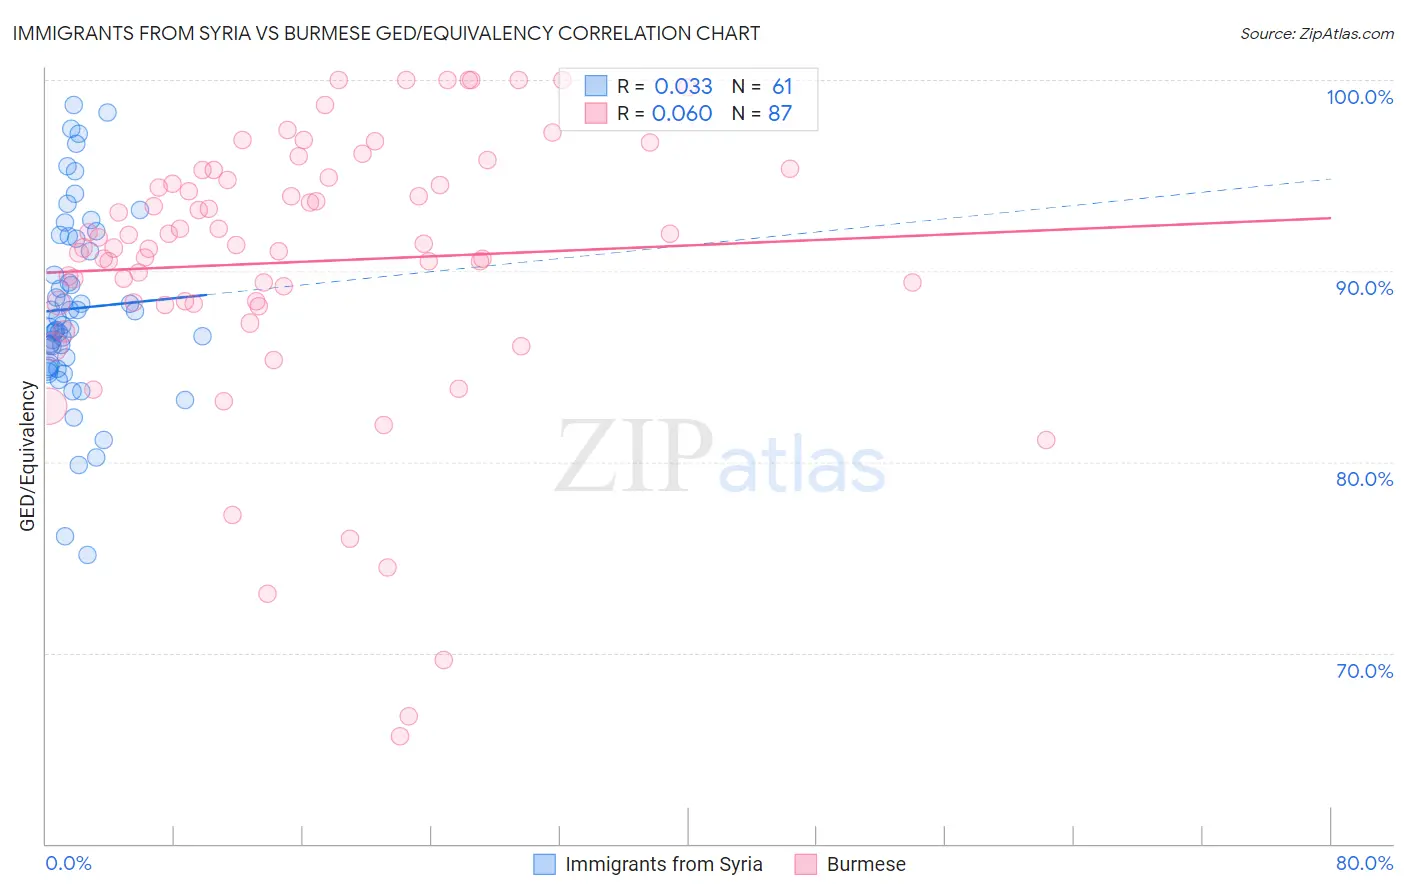
Immigrants from Syria vs Burmese GED/Equivalency Correlation Chart
The statistical analysis conducted on geographies consisting of 174,108,882 people shows no correlation between the proportion of Immigrants from Syria and percentage of population with at least ged/equivalency education in the United States with a correlation coefficient (R) of 0.033 and weighted average of 86.1%. Similarly, the statistical analysis conducted on geographies consisting of 465,408,087 people shows a slight positive correlation between the proportion of Burmese and percentage of population with at least ged/equivalency education in the United States with a correlation coefficient (R) of 0.060 and weighted average of 88.3%, a difference of 2.5%.
GED/Equivalency Correlation Summary
| Measurement | Immigrants from Syria | Burmese |
| Minimum | 75.1% | 65.6% |
| Maximum | 98.7% | 100.0% |
| Range | 23.5% | 34.4% |
| Mean | 88.0% | 90.5% |
| Median | 87.1% | 91.4% |
| Interquartile 25% (IQ1) | 85.0% | 88.3% |
| Interquartile 75% (IQ3) | 91.8% | 94.9% |
| Interquartile Range (IQR) | 6.7% | 6.6% |
| Standard Deviation (Sample) | 5.0% | 7.2% |
| Standard Deviation (Population) | 4.9% | 7.1% |
Similar Demographics by GED/Equivalency
Demographics Similar to Immigrants from Syria by GED/Equivalency
In terms of ged/equivalency, the demographic groups most similar to Immigrants from Syria are Immigrants from Morocco (86.1%, a difference of 0.010%), Immigrants from Iraq (86.1%, a difference of 0.030%), Immigrants from Kenya (86.2%, a difference of 0.060%), White/Caucasian (86.2%, a difference of 0.070%), and German Russian (86.2%, a difference of 0.070%).
| Demographics | Rating | Rank | GED/Equivalency |
| Armenians | 76.4 /100 | #154 | Good 86.3% |
| Iraqis | 75.2 /100 | #155 | Good 86.2% |
| Immigrants | Nepal | 73.3 /100 | #156 | Good 86.2% |
| Whites/Caucasians | 72.2 /100 | #157 | Good 86.2% |
| German Russians | 72.1 /100 | #158 | Good 86.2% |
| Immigrants | Kenya | 71.8 /100 | #159 | Good 86.2% |
| Immigrants | Morocco | 69.5 /100 | #160 | Good 86.1% |
| Immigrants | Syria | 69.3 /100 | #161 | Good 86.1% |
| Immigrants | Iraq | 68.1 /100 | #162 | Good 86.1% |
| Ugandans | 66.3 /100 | #163 | Good 86.1% |
| Venezuelans | 65.5 /100 | #164 | Good 86.0% |
| Alsatians | 64.3 /100 | #165 | Good 86.0% |
| Immigrants | Albania | 64.2 /100 | #166 | Good 86.0% |
| Ethiopians | 63.7 /100 | #167 | Good 86.0% |
| Sierra Leoneans | 61.8 /100 | #168 | Good 86.0% |
Demographics Similar to Burmese by GED/Equivalency
In terms of ged/equivalency, the demographic groups most similar to Burmese are Immigrants from Austria (88.3%, a difference of 0.030%), Immigrants from Belgium (88.3%, a difference of 0.060%), Immigrants from South Central Asia (88.4%, a difference of 0.080%), Immigrants from Israel (88.2%, a difference of 0.090%), and Immigrants from Sweden (88.4%, a difference of 0.10%).
| Demographics | Rating | Rank | GED/Equivalency |
| Bhutanese | 99.8 /100 | #31 | Exceptional 88.4% |
| Danes | 99.8 /100 | #32 | Exceptional 88.4% |
| Immigrants | Sweden | 99.7 /100 | #33 | Exceptional 88.4% |
| Immigrants | Japan | 99.7 /100 | #34 | Exceptional 88.4% |
| Immigrants | South Central Asia | 99.7 /100 | #35 | Exceptional 88.4% |
| Immigrants | Belgium | 99.7 /100 | #36 | Exceptional 88.3% |
| Immigrants | Austria | 99.7 /100 | #37 | Exceptional 88.3% |
| Burmese | 99.7 /100 | #38 | Exceptional 88.3% |
| Immigrants | Israel | 99.6 /100 | #39 | Exceptional 88.2% |
| Italians | 99.6 /100 | #40 | Exceptional 88.2% |
| Finns | 99.6 /100 | #41 | Exceptional 88.2% |
| Cambodians | 99.6 /100 | #42 | Exceptional 88.2% |
| Immigrants | Scotland | 99.6 /100 | #43 | Exceptional 88.2% |
| Macedonians | 99.5 /100 | #44 | Exceptional 88.1% |
| Czechs | 99.5 /100 | #45 | Exceptional 88.1% |