Immigrants from Syria vs Immigrants from Bolivia GED/Equivalency
COMPARE
Immigrants from Syria
Immigrants from Bolivia
GED/Equivalency
GED/Equivalency Comparison
Immigrants from Syria
Immigrants from Bolivia
86.1%
GED/EQUIVALENCY
69.3/ 100
METRIC RATING
161st/ 347
METRIC RANK
85.8%
GED/EQUIVALENCY
49.8/ 100
METRIC RATING
175th/ 347
METRIC RANK
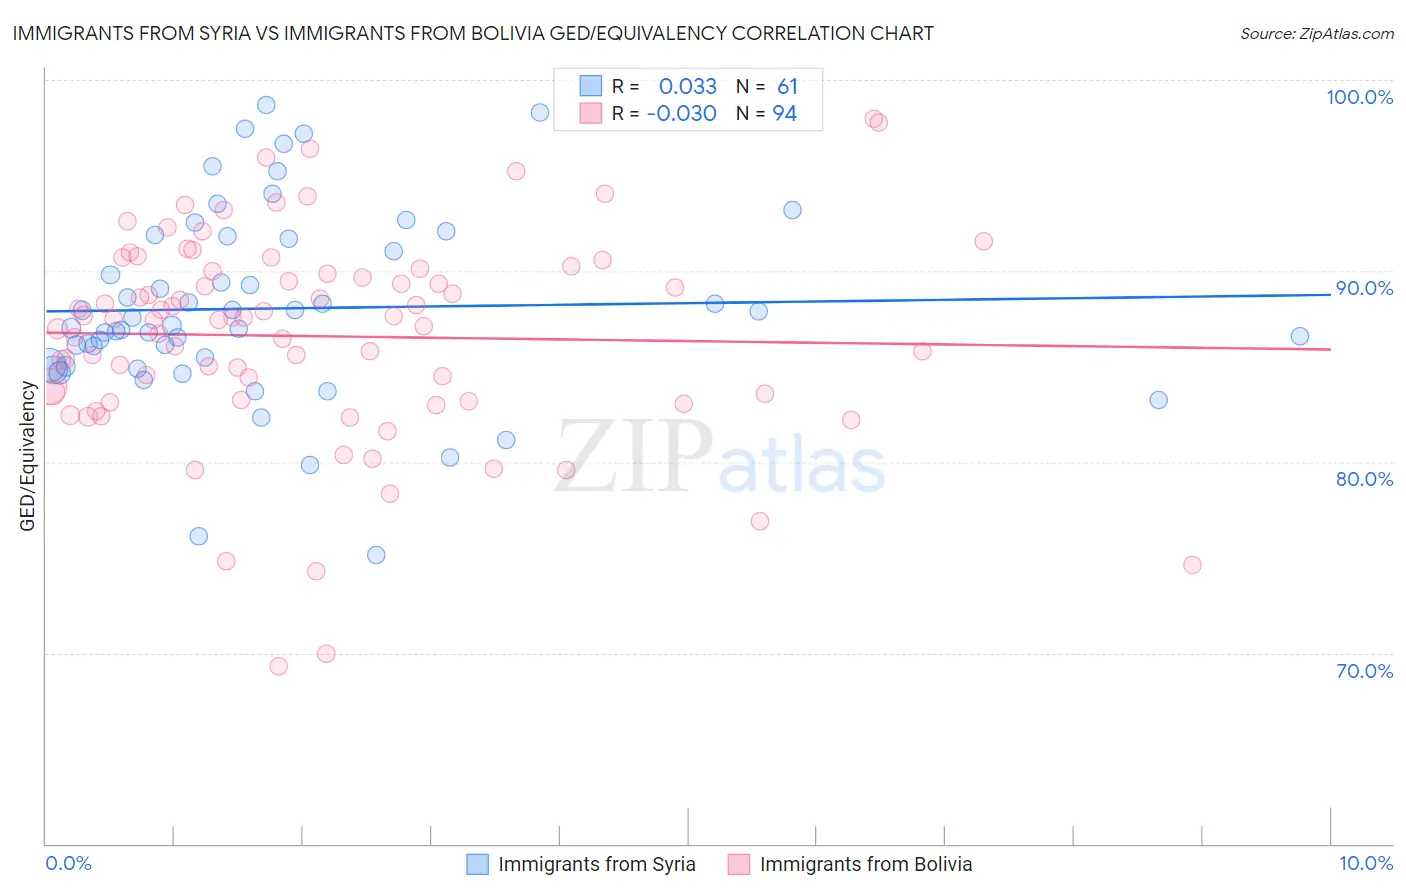
Immigrants from Syria vs Immigrants from Bolivia GED/Equivalency Correlation Chart
The statistical analysis conducted on geographies consisting of 174,108,882 people shows no correlation between the proportion of Immigrants from Syria and percentage of population with at least ged/equivalency education in the United States with a correlation coefficient (R) of 0.033 and weighted average of 86.1%. Similarly, the statistical analysis conducted on geographies consisting of 158,730,894 people shows no correlation between the proportion of Immigrants from Bolivia and percentage of population with at least ged/equivalency education in the United States with a correlation coefficient (R) of -0.030 and weighted average of 85.8%, a difference of 0.42%.
GED/Equivalency Correlation Summary
| Measurement | Immigrants from Syria | Immigrants from Bolivia |
| Minimum | 75.1% | 69.3% |
| Maximum | 98.7% | 98.0% |
| Range | 23.5% | 28.7% |
| Mean | 88.0% | 86.6% |
| Median | 87.1% | 87.5% |
| Interquartile 25% (IQ1) | 85.0% | 83.3% |
| Interquartile 75% (IQ3) | 91.8% | 90.0% |
| Interquartile Range (IQR) | 6.7% | 6.7% |
| Standard Deviation (Sample) | 5.0% | 5.5% |
| Standard Deviation (Population) | 4.9% | 5.4% |
Demographics Similar to Immigrants from Syria and Immigrants from Bolivia by GED/Equivalency
In terms of ged/equivalency, the demographic groups most similar to Immigrants from Syria are Immigrants from Morocco (86.1%, a difference of 0.010%), Immigrants from Iraq (86.1%, a difference of 0.030%), Immigrants from Kenya (86.2%, a difference of 0.060%), German Russian (86.2%, a difference of 0.070%), and Ugandan (86.1%, a difference of 0.070%). Similarly, the demographic groups most similar to Immigrants from Bolivia are Ottawa (85.8%, a difference of 0.0%), Immigrants from Venezuela (85.8%, a difference of 0.020%), Immigrants from Eastern Africa (85.7%, a difference of 0.040%), Immigrants from Uganda (85.7%, a difference of 0.10%), and Bermudan (85.8%, a difference of 0.11%).
| Demographics | Rating | Rank | GED/Equivalency |
| German Russians | 72.1 /100 | #158 | Good 86.2% |
| Immigrants | Kenya | 71.8 /100 | #159 | Good 86.2% |
| Immigrants | Morocco | 69.5 /100 | #160 | Good 86.1% |
| Immigrants | Syria | 69.3 /100 | #161 | Good 86.1% |
| Immigrants | Iraq | 68.1 /100 | #162 | Good 86.1% |
| Ugandans | 66.3 /100 | #163 | Good 86.1% |
| Venezuelans | 65.5 /100 | #164 | Good 86.0% |
| Alsatians | 64.3 /100 | #165 | Good 86.0% |
| Immigrants | Albania | 64.2 /100 | #166 | Good 86.0% |
| Ethiopians | 63.7 /100 | #167 | Good 86.0% |
| Sierra Leoneans | 61.8 /100 | #168 | Good 86.0% |
| Immigrants | Ethiopia | 61.2 /100 | #169 | Good 86.0% |
| Afghans | 59.7 /100 | #170 | Average 85.9% |
| Immigrants | Chile | 57.3 /100 | #171 | Average 85.9% |
| Bermudans | 55.1 /100 | #172 | Average 85.8% |
| Immigrants | Venezuela | 50.7 /100 | #173 | Average 85.8% |
| Ottawa | 50.0 /100 | #174 | Average 85.8% |
| Immigrants | Bolivia | 49.8 /100 | #175 | Average 85.8% |
| Immigrants | Eastern Africa | 47.7 /100 | #176 | Average 85.7% |
| Immigrants | Uganda | 45.2 /100 | #177 | Average 85.7% |
| Koreans | 41.2 /100 | #178 | Average 85.6% |