Immigrants from Syria vs Immigrants from Dominican Republic GED/Equivalency
COMPARE
Immigrants from Syria
Immigrants from Dominican Republic
GED/Equivalency
GED/Equivalency Comparison
Immigrants from Syria
Immigrants from Dominican Republic
86.1%
GED/EQUIVALENCY
69.3/ 100
METRIC RATING
161st/ 347
METRIC RANK
78.0%
GED/EQUIVALENCY
0.0/ 100
METRIC RATING
336th/ 347
METRIC RANK
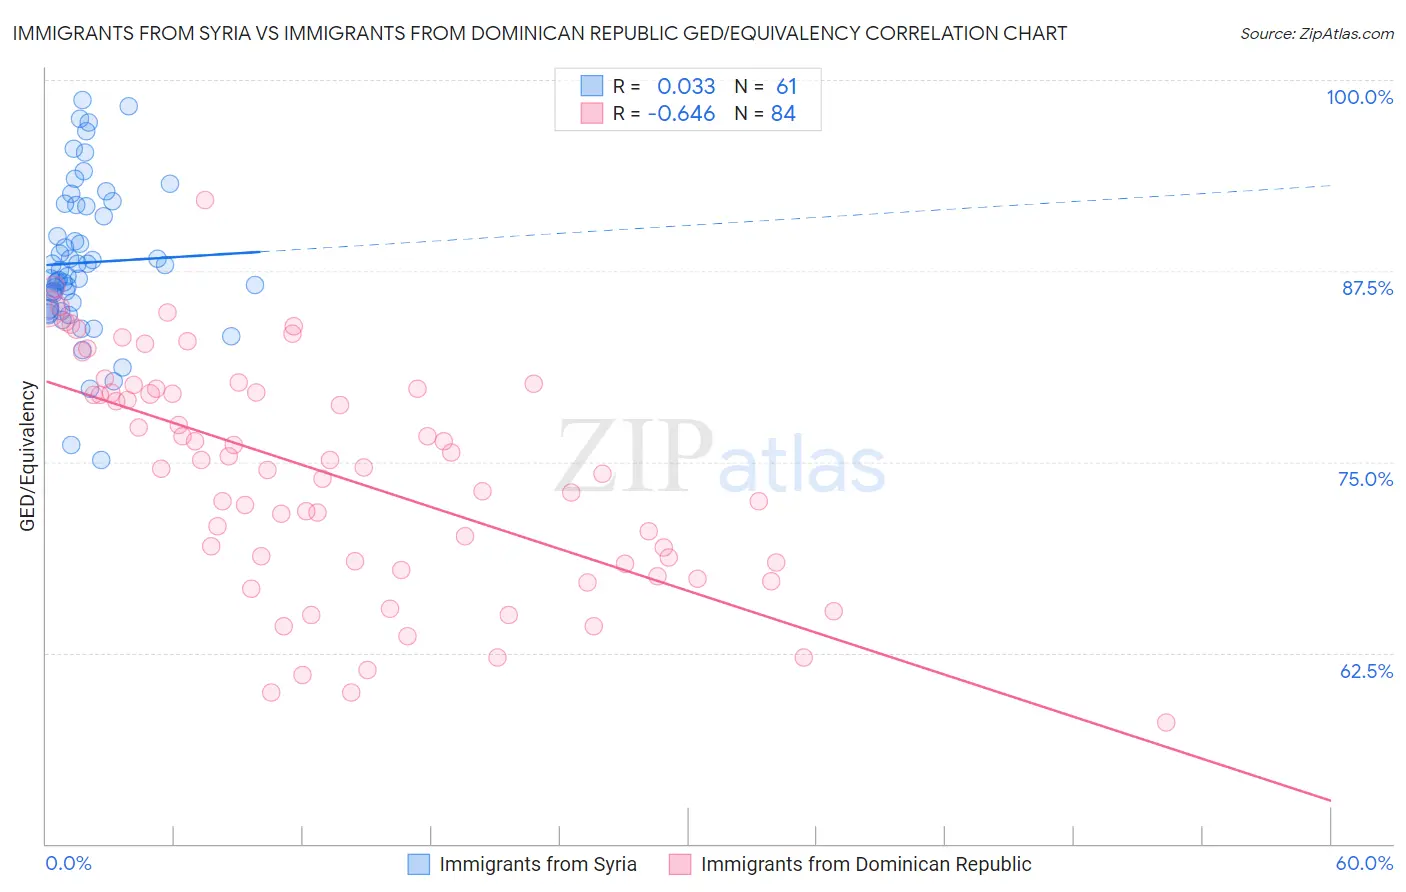
Immigrants from Syria vs Immigrants from Dominican Republic GED/Equivalency Correlation Chart
The statistical analysis conducted on geographies consisting of 174,108,882 people shows no correlation between the proportion of Immigrants from Syria and percentage of population with at least ged/equivalency education in the United States with a correlation coefficient (R) of 0.033 and weighted average of 86.1%. Similarly, the statistical analysis conducted on geographies consisting of 275,144,500 people shows a significant negative correlation between the proportion of Immigrants from Dominican Republic and percentage of population with at least ged/equivalency education in the United States with a correlation coefficient (R) of -0.646 and weighted average of 78.0%, a difference of 10.4%.
GED/Equivalency Correlation Summary
| Measurement | Immigrants from Syria | Immigrants from Dominican Republic |
| Minimum | 75.1% | 58.0% |
| Maximum | 98.7% | 92.2% |
| Range | 23.5% | 34.2% |
| Mean | 88.0% | 74.1% |
| Median | 87.1% | 74.6% |
| Interquartile 25% (IQ1) | 85.0% | 68.4% |
| Interquartile 75% (IQ3) | 91.8% | 79.6% |
| Interquartile Range (IQR) | 6.7% | 11.3% |
| Standard Deviation (Sample) | 5.0% | 7.5% |
| Standard Deviation (Population) | 4.9% | 7.4% |
Similar Demographics by GED/Equivalency
Demographics Similar to Immigrants from Syria by GED/Equivalency
In terms of ged/equivalency, the demographic groups most similar to Immigrants from Syria are Immigrants from Morocco (86.1%, a difference of 0.010%), Immigrants from Iraq (86.1%, a difference of 0.030%), Immigrants from Kenya (86.2%, a difference of 0.060%), White/Caucasian (86.2%, a difference of 0.070%), and German Russian (86.2%, a difference of 0.070%).
| Demographics | Rating | Rank | GED/Equivalency |
| Armenians | 76.4 /100 | #154 | Good 86.3% |
| Iraqis | 75.2 /100 | #155 | Good 86.2% |
| Immigrants | Nepal | 73.3 /100 | #156 | Good 86.2% |
| Whites/Caucasians | 72.2 /100 | #157 | Good 86.2% |
| German Russians | 72.1 /100 | #158 | Good 86.2% |
| Immigrants | Kenya | 71.8 /100 | #159 | Good 86.2% |
| Immigrants | Morocco | 69.5 /100 | #160 | Good 86.1% |
| Immigrants | Syria | 69.3 /100 | #161 | Good 86.1% |
| Immigrants | Iraq | 68.1 /100 | #162 | Good 86.1% |
| Ugandans | 66.3 /100 | #163 | Good 86.1% |
| Venezuelans | 65.5 /100 | #164 | Good 86.0% |
| Alsatians | 64.3 /100 | #165 | Good 86.0% |
| Immigrants | Albania | 64.2 /100 | #166 | Good 86.0% |
| Ethiopians | 63.7 /100 | #167 | Good 86.0% |
| Sierra Leoneans | 61.8 /100 | #168 | Good 86.0% |
Demographics Similar to Immigrants from Dominican Republic by GED/Equivalency
In terms of ged/equivalency, the demographic groups most similar to Immigrants from Dominican Republic are Immigrants from Yemen (77.9%, a difference of 0.060%), Immigrants from Guatemala (77.9%, a difference of 0.090%), Immigrants from El Salvador (77.6%, a difference of 0.47%), Immigrants from Latin America (78.5%, a difference of 0.63%), and Tohono O'odham (77.5%, a difference of 0.63%).
| Demographics | Rating | Rank | GED/Equivalency |
| Dominicans | 0.0 /100 | #329 | Tragic 79.1% |
| Immigrants | Cabo Verde | 0.0 /100 | #330 | Tragic 78.9% |
| Immigrants | Honduras | 0.0 /100 | #331 | Tragic 78.7% |
| Immigrants | Azores | 0.0 /100 | #332 | Tragic 78.7% |
| Salvadorans | 0.0 /100 | #333 | Tragic 78.6% |
| Guatemalans | 0.0 /100 | #334 | Tragic 78.5% |
| Immigrants | Latin America | 0.0 /100 | #335 | Tragic 78.5% |
| Immigrants | Dominican Republic | 0.0 /100 | #336 | Tragic 78.0% |
| Immigrants | Yemen | 0.0 /100 | #337 | Tragic 77.9% |
| Immigrants | Guatemala | 0.0 /100 | #338 | Tragic 77.9% |
| Immigrants | El Salvador | 0.0 /100 | #339 | Tragic 77.6% |
| Tohono O'odham | 0.0 /100 | #340 | Tragic 77.5% |
| Mexicans | 0.0 /100 | #341 | Tragic 77.4% |
| Pima | 0.0 /100 | #342 | Tragic 76.4% |
| Immigrants | Central America | 0.0 /100 | #343 | Tragic 76.4% |