Hispanic or Latino vs Immigrants from Ecuador GED/Equivalency
COMPARE
Hispanic or Latino
Immigrants from Ecuador
GED/Equivalency
GED/Equivalency Comparison
Hispanics or Latinos
Immigrants from Ecuador
79.1%
GED/EQUIVALENCY
0.0/ 100
METRIC RATING
328th/ 347
METRIC RANK
81.0%
GED/EQUIVALENCY
0.0/ 100
METRIC RATING
309th/ 347
METRIC RANK
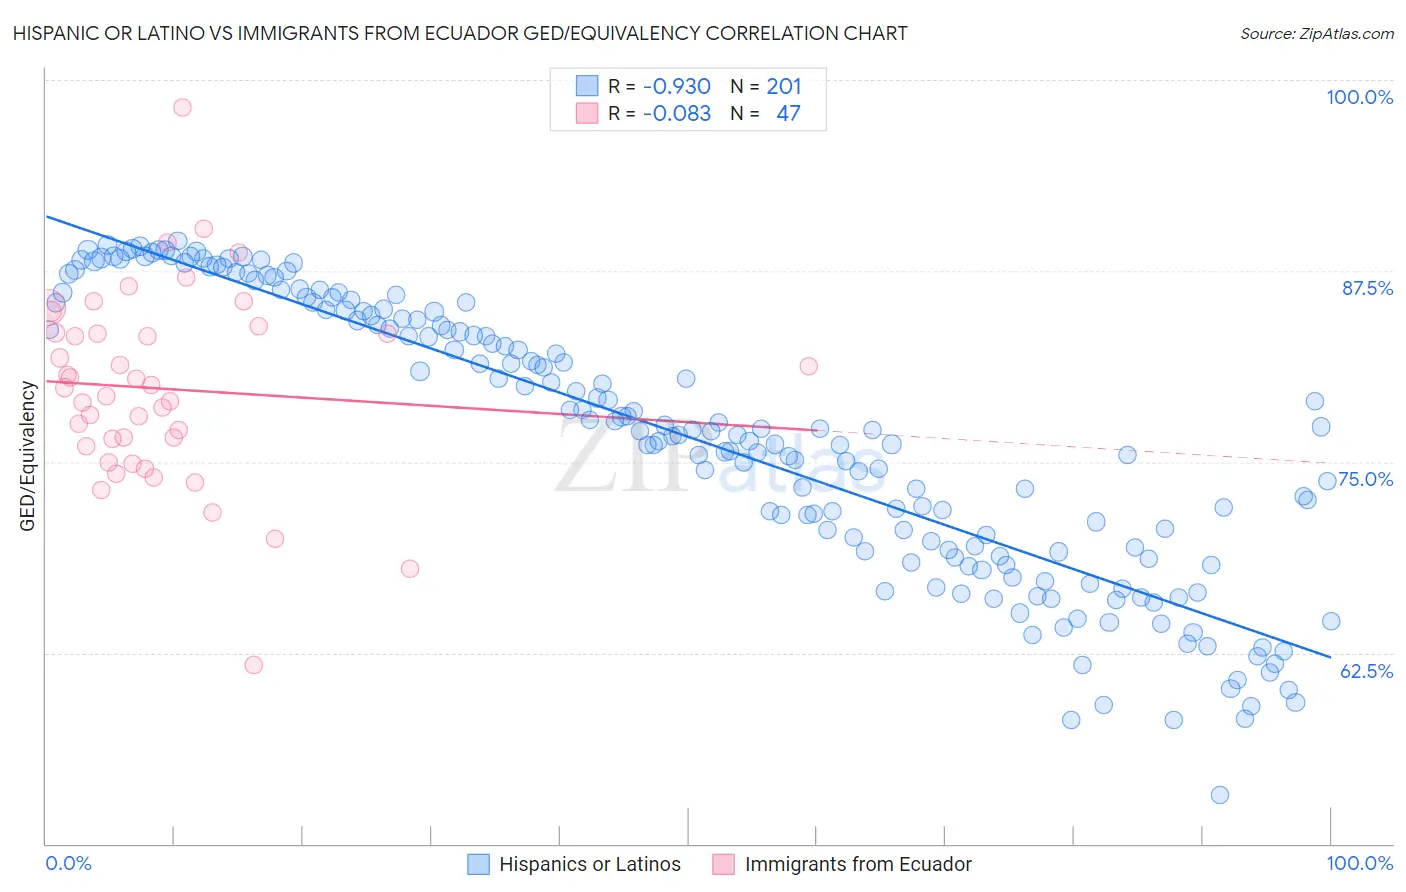
Hispanic or Latino vs Immigrants from Ecuador GED/Equivalency Correlation Chart
The statistical analysis conducted on geographies consisting of 578,611,870 people shows a near-perfect negative correlation between the proportion of Hispanics or Latinos and percentage of population with at least ged/equivalency education in the United States with a correlation coefficient (R) of -0.930 and weighted average of 79.1%. Similarly, the statistical analysis conducted on geographies consisting of 271,020,679 people shows a slight negative correlation between the proportion of Immigrants from Ecuador and percentage of population with at least ged/equivalency education in the United States with a correlation coefficient (R) of -0.083 and weighted average of 81.0%, a difference of 2.4%.
GED/Equivalency Correlation Summary
| Measurement | Hispanic or Latino | Immigrants from Ecuador |
| Minimum | 53.2% | 61.7% |
| Maximum | 89.5% | 98.2% |
| Range | 36.2% | 36.5% |
| Mean | 76.6% | 79.8% |
| Median | 77.1% | 79.8% |
| Interquartile 25% (IQ1) | 69.1% | 76.0% |
| Interquartile 75% (IQ3) | 84.9% | 83.5% |
| Interquartile Range (IQR) | 15.7% | 7.5% |
| Standard Deviation (Sample) | 9.0% | 6.3% |
| Standard Deviation (Population) | 9.0% | 6.3% |
Demographics Similar to Hispanics or Latinos and Immigrants from Ecuador by GED/Equivalency
In terms of ged/equivalency, the demographic groups most similar to Hispanics or Latinos are Central American (79.2%, a difference of 0.10%), Yuman (79.2%, a difference of 0.13%), Honduran (79.3%, a difference of 0.22%), Mexican American Indian (79.4%, a difference of 0.34%), and Immigrants from Nicaragua (79.9%, a difference of 0.98%). Similarly, the demographic groups most similar to Immigrants from Ecuador are Immigrants from Guyana (81.0%, a difference of 0.060%), Native/Alaskan (80.9%, a difference of 0.070%), Puerto Rican (81.1%, a difference of 0.080%), Nicaraguan (80.9%, a difference of 0.10%), and Cape Verdean (80.9%, a difference of 0.10%).
| Demographics | Rating | Rank | GED/Equivalency |
| Puerto Ricans | 0.0 /100 | #308 | Tragic 81.1% |
| Immigrants | Ecuador | 0.0 /100 | #309 | Tragic 81.0% |
| Immigrants | Guyana | 0.0 /100 | #310 | Tragic 81.0% |
| Natives/Alaskans | 0.0 /100 | #311 | Tragic 80.9% |
| Nicaraguans | 0.0 /100 | #312 | Tragic 80.9% |
| Cape Verdeans | 0.0 /100 | #313 | Tragic 80.9% |
| Belizeans | 0.0 /100 | #314 | Tragic 80.9% |
| Apache | 0.0 /100 | #315 | Tragic 80.7% |
| Central American Indians | 0.0 /100 | #316 | Tragic 80.6% |
| Immigrants | Caribbean | 0.0 /100 | #317 | Tragic 80.5% |
| Yaqui | 0.0 /100 | #318 | Tragic 80.5% |
| Immigrants | Belize | 0.0 /100 | #319 | Tragic 80.5% |
| Immigrants | Cuba | 0.0 /100 | #320 | Tragic 80.2% |
| Yup'ik | 0.0 /100 | #321 | Tragic 80.0% |
| Lumbee | 0.0 /100 | #322 | Tragic 80.0% |
| Immigrants | Nicaragua | 0.0 /100 | #323 | Tragic 79.9% |
| Mexican American Indians | 0.0 /100 | #324 | Tragic 79.4% |
| Hondurans | 0.0 /100 | #325 | Tragic 79.3% |
| Yuman | 0.0 /100 | #326 | Tragic 79.2% |
| Central Americans | 0.0 /100 | #327 | Tragic 79.2% |
| Hispanics or Latinos | 0.0 /100 | #328 | Tragic 79.1% |